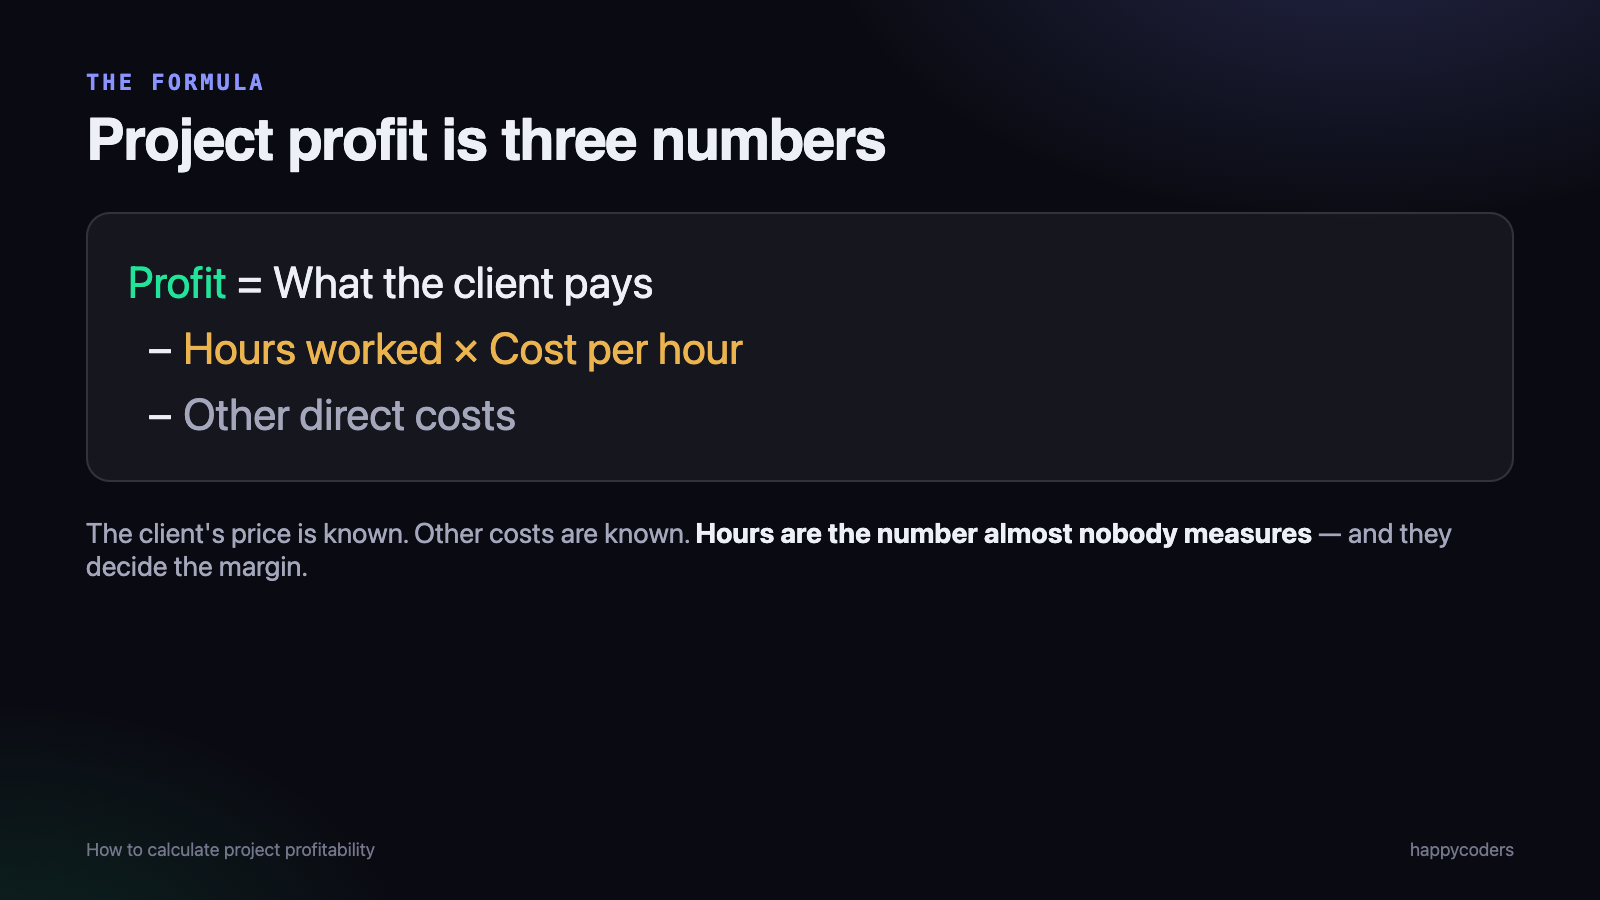
Project profitability is what the client pays, minus the cost of the hours your team spent on it, minus any other direct costs. The only hard part is the hours — most agencies know the price and the expenses to the rupee and have no reliable number for the time. This guide shows the calculation step by step with a worked example in rupees, and gives you a free Excel template that does the arithmetic for you.
Step 1 — Work out what one hour costs
Salary alone understates the cost of a person’s hour. Rent, software, equipment, paid leave and admin all have to be paid for by the hours that are billed. The usual way to include them is an overhead multiplier.
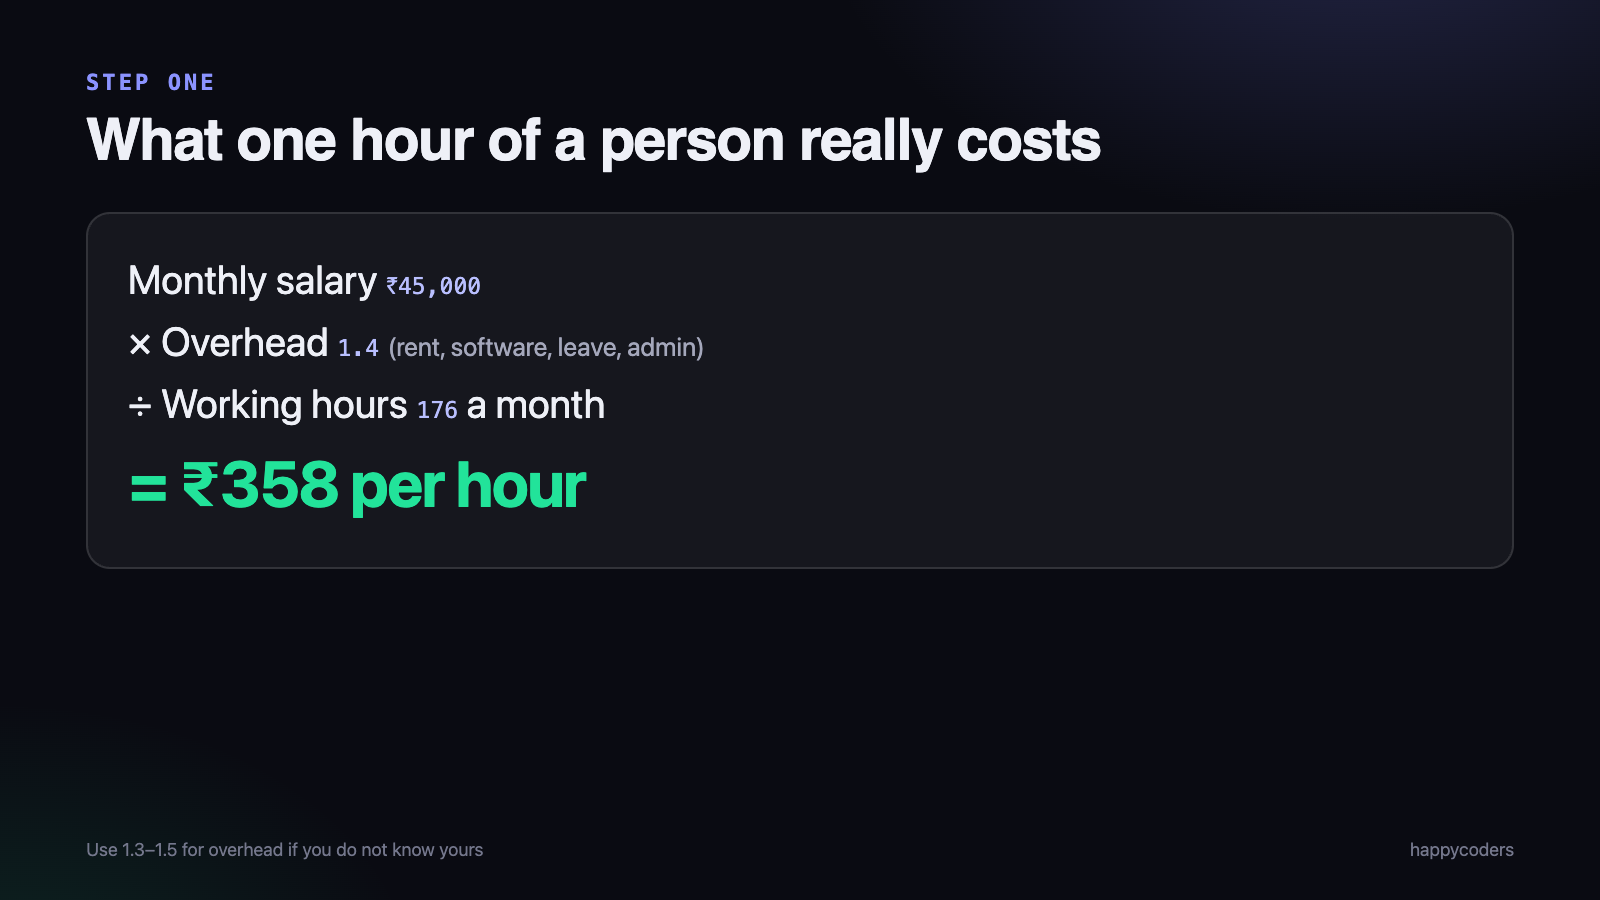
Take the monthly salary, multiply by an overhead factor, and divide by working hours in a month. For a ₹45,000 salary, an overhead of 1.4 and 176 working hours, one hour costs about ₹358. If you do not know your overhead, 1.3 to 1.5 is a reasonable range for a small Indian services company; the template lets you change it in one cell.
Do this for each person, or use a single blended rate for the team if you want a quick answer. A blended rate is less precise but far better than no rate at all.
Step 2 — Count every hour, including the ones you do not bill
This is where the calculation usually breaks. Quoted hours are easy to find. Worked hours are not, and the missing hours are never random — they are the revisions, the extra calls, the fixes after review and the “small change” that took a day. Those hours cost exactly as much as billable ones.
Split the hours into two groups: billable, which the client pays for, and non-billable, which you absorb. The non-billable group is where the margin goes.
Step 3 — Put it together
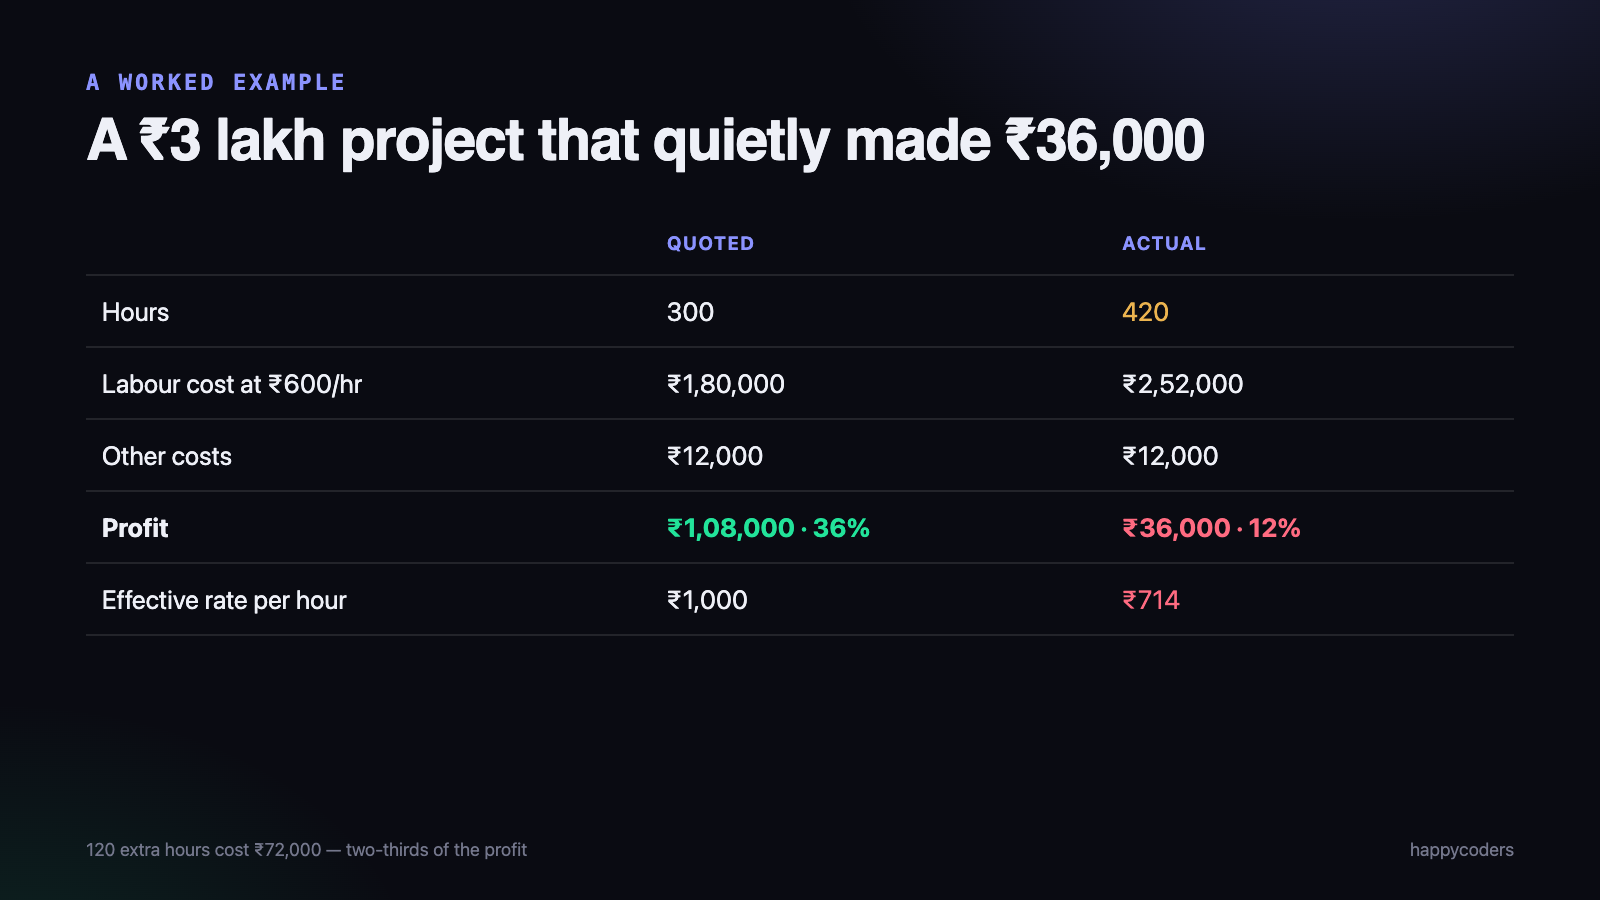
Here is a realistic example. A website and app project is quoted at ₹3,00,000 for 300 hours, with a blended team cost of ₹600 an hour and ₹12,000 of other costs.
- As quoted: 300 hours × ₹600 = ₹1,80,000 labour, plus ₹12,000 = ₹1,92,000 cost. Profit ₹1,08,000 — a 36% margin.
- As delivered: the project took 420 hours. 420 × ₹600 = ₹2,52,000 labour, plus ₹12,000 = ₹2,64,000 cost. Profit ₹36,000 — a 12% margin.
The 120 extra hours cost ₹72,000, which is two-thirds of the profit the project was supposed to make. Nothing about the invoice changed. Nobody made an obvious mistake. The money went on hours that were never counted.
The number worth watching: effective rate per hour
Divide what the client paid by the hours actually worked. Quoted, this project earned ₹1,000 an hour. Delivered, it earned ₹714. If your effective rate on a project is well below the rate you think you charge, time leaked somewhere — and the effective rate tells you that long before the year-end accounts do.
Where project profit usually goes
- Scope creep. Small additions accepted without a change to the price. Each one is reasonable; together they are the largest leak in most agencies.
- Revisions. Extra rounds beyond what was agreed. Track them as non-billable so they are visible.
- Estimates that never get checked. If you never compare estimated hours with actual hours, next quarter’s quotes repeat this quarter’s mistake.
- Unrecorded time. Calls, reviews and quick fixes that nobody logs. They are real cost and they are invisible.
Blended rate or per-person rate?
A blended rate — one average cost per hour for the whole team — is fast and good enough for a first look. It hides one thing: who spent the hours. A project that ran over because a senior developer spent forty hours on it cost far more than one where a junior did, even though the hours match.
Start blended if you have nothing. Move to per-person rates once you are tracking time properly; the template supports both, because each person on the Team sheet has their own cost per hour.
Check it during the project, not after
Profitability calculated after the project closes is a post-mortem. The same calculation done weekly is a warning light. Once a week, look at two numbers: hours used against hours estimated, and the effective rate per hour so far.
If a project has used 70% of its estimated hours and delivered half the work, you have time to act — raise a change request, cut scope, or at least stop the next quote from repeating the mistake. At 100% of the hours, all you can do is absorb the loss.
Pricing the next project from this one
Once you know what similar work actually cost, you can price for the margin you want instead of guessing. Take the real cost and divide by one minus the target margin.
If a project like the example above really costs ₹2,64,000 and you want a 30% margin, the price is ₹2,64,000 ÷ 0.7 = ₹3,77,143. At that price the profit is ₹1,13,143, which is 30% of the price — not 30% added on top of cost. Adding 30% to cost gives only a 23% margin, a common and expensive mix-up.
Fixed price or hourly — does it change the calculation?
The formula is the same; what changes is who pays for extra hours. On a fixed-price project every hour over the estimate comes straight out of your profit. On time and materials billing the client pays for the extra billable hours, but the non-billable ones — internal reviews, rework, calls you did not charge for — still come out of your margin. Either way, the hours you do not record are the ones that hurt.
Download the free template
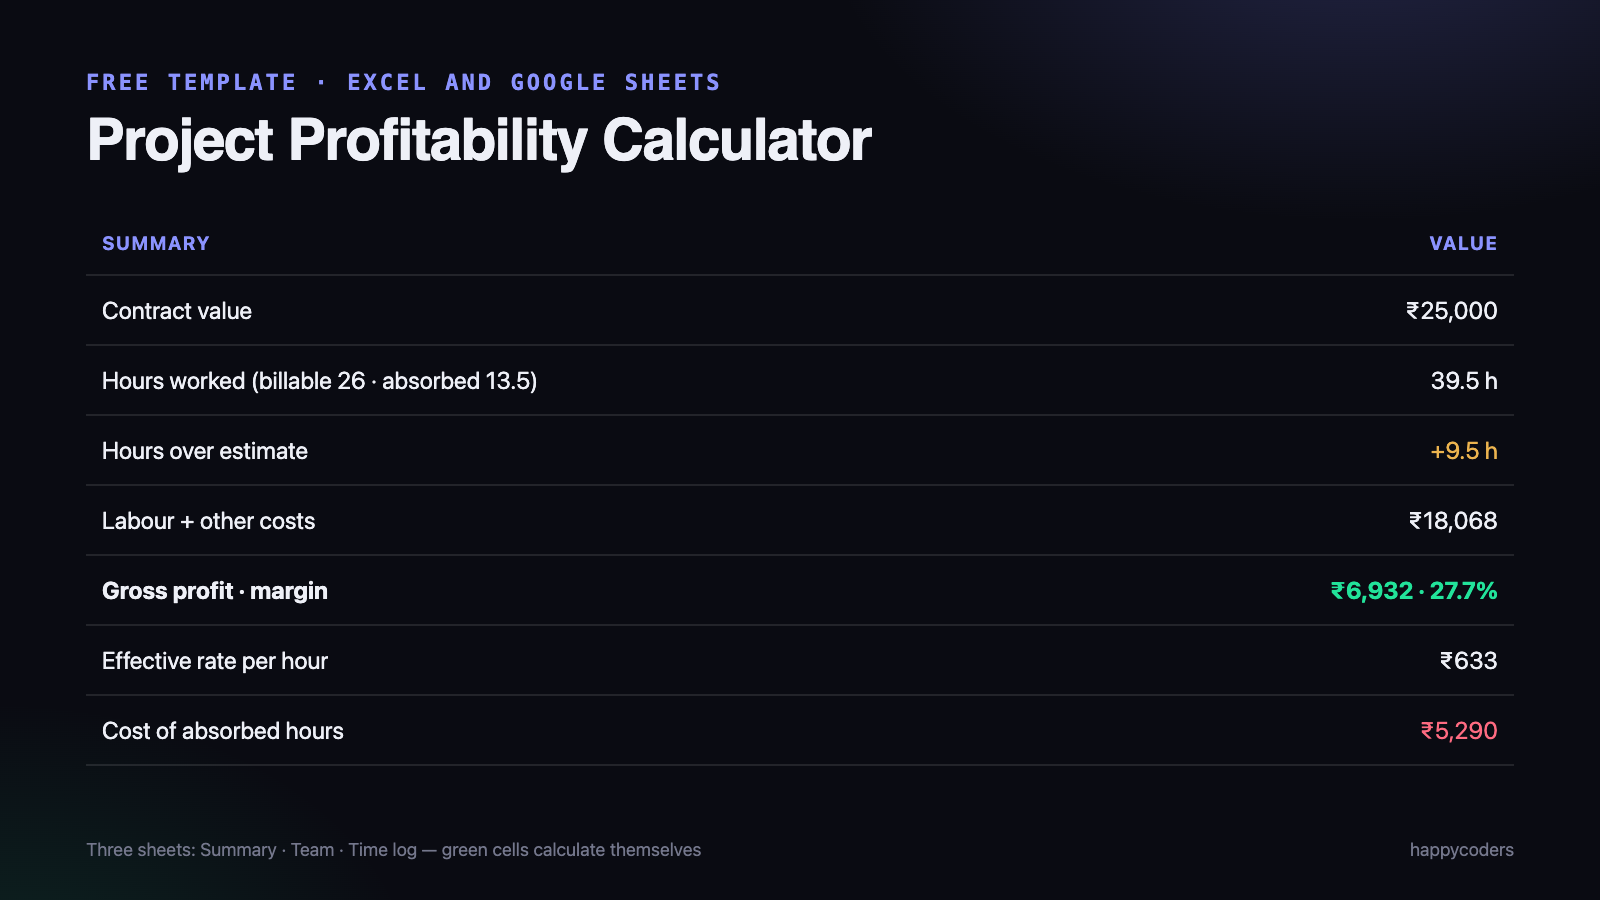
The Project Profitability Calculator is an Excel file that also opens in Google Sheets. It has three sheets:
- Team — each person’s salary and billable rate. It works out their cost per hour from your overhead and working hours.
- Time log — one row per work session, with a Y/N column for billable. Cost and billed value fill in automatically.
- Summary — contract value, other costs and estimated hours. It shows hours worked, billable and absorbed hours, hours over estimate, total cost, profit, margin, effective rate per hour, and the cost of the hours you absorbed.
It comes filled with example numbers so you can see how it behaves. Replace them with your own project and it recalculates as you type.
Download the Project Profitability Calculator (.xlsx)
Getting the hours without chasing people
The template does the maths. What it cannot do is produce the hours — somebody has to record them, every day, against the right project, and that is exactly what breaks when it depends on memory at month end.

Happy Tracker records time as people work: every session is attached to a project and a task, split into billable and non-billable, with estimates sitting next to actual hours on each task. The reports export to CSV, so the Time log sheet in this template can be filled from an export in a minute instead of rebuilt from memory.
It is free for up to five users with no time limit, which is enough to run one live project through it and see where that project’s hours actually went. Start free at happytracker.happycoders.in.
Frequently asked questions
What is a good profit margin for a service project?
It varies by industry and company, but many small agencies aim for somewhere around 20–40% gross margin on a project. More useful than any benchmark is your own trend: if margins are falling project after project, estimates or scope control are slipping.
Should I include my own time if I am the owner?
Yes. An owner’s hours on a project are real cost even if no salary is paid for them. Leaving them out makes every project look more profitable than it is, and you will quote too low.
Profit margin or effective hourly rate — which matters more?
Both, for different reasons. Margin tells you whether the project made money. Effective hourly rate tells you whether it was a good use of your team’s time compared with the rest of your work.