Ask ten software companies in India how they arrive at a quote and eight will describe the same process. Somebody senior reads the requirement, pictures the work, thinks “that is about three weeks”, multiplies by a day rate, adds a bit for comfort, and sends it. Six weeks later the project is still open.
This is not carelessness. It is what happens when a number is produced by imagination rather than measurement. And the interesting part — the part that makes it fixable — is that the error is not random. It runs in one direction, every time, for reasons you can name and correct with data you may already have.
Why gut-feel quotes are wrong in one direction only
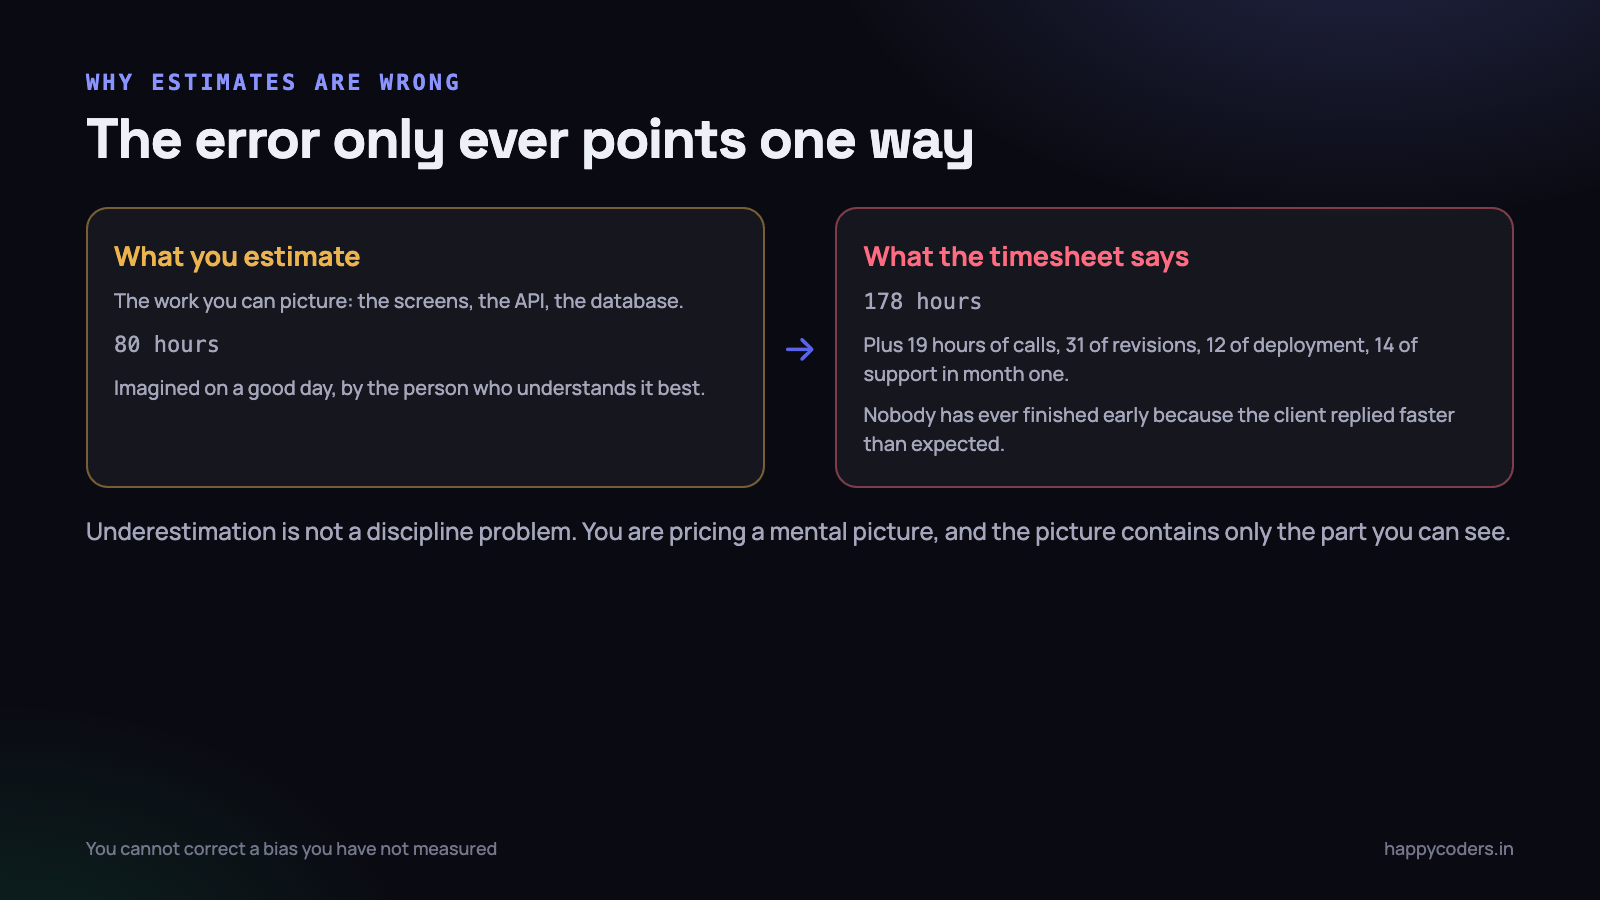
If estimating were merely imprecise, you would overrun half the time and finish early the other half. Nobody finishes early. In fifteen years of delivery work we have never once had a project come in under a gut-feel quote because the client replied faster than expected.
The reason is mechanical. When you estimate, you price the work you can picture: the screens, the API calls, the database design, the integration. That mental picture is complete and vivid, and it is also the only part of the project you can see clearly from the outside.
What the picture leaves out is everything that is not building. The Tuesday call that ran forty minutes because the client brought their operations head. The second review round where the layout changes. The four hours spent on a staging server that behaves differently from your laptop. The three days in month one where the client’s accounts person could not log in.
None of those feel like the project. All of them are paid for out of the project’s budget. So the estimate is systematically short by roughly the size of everything you did not imagine — and that has a stable ratio you can measure.
There is a second, quieter reason. The estimate is usually made by the person who understands the work best, imagining themselves doing it on a good day with no interruptions. Almost nobody works that day. If a senior developer estimates and a mid-level developer builds, the gap widens again.
The ratio of build time to everything else
This is the single most valuable number your tracked hours can give you, and most companies have never calculated it.
Take a finished project — a real one, delivered, invoiced. Open the time log and split every hour into five buckets: building, communication, revisions, deployment and handover, and post-delivery support. Do it for five projects. The pattern is usually stark.
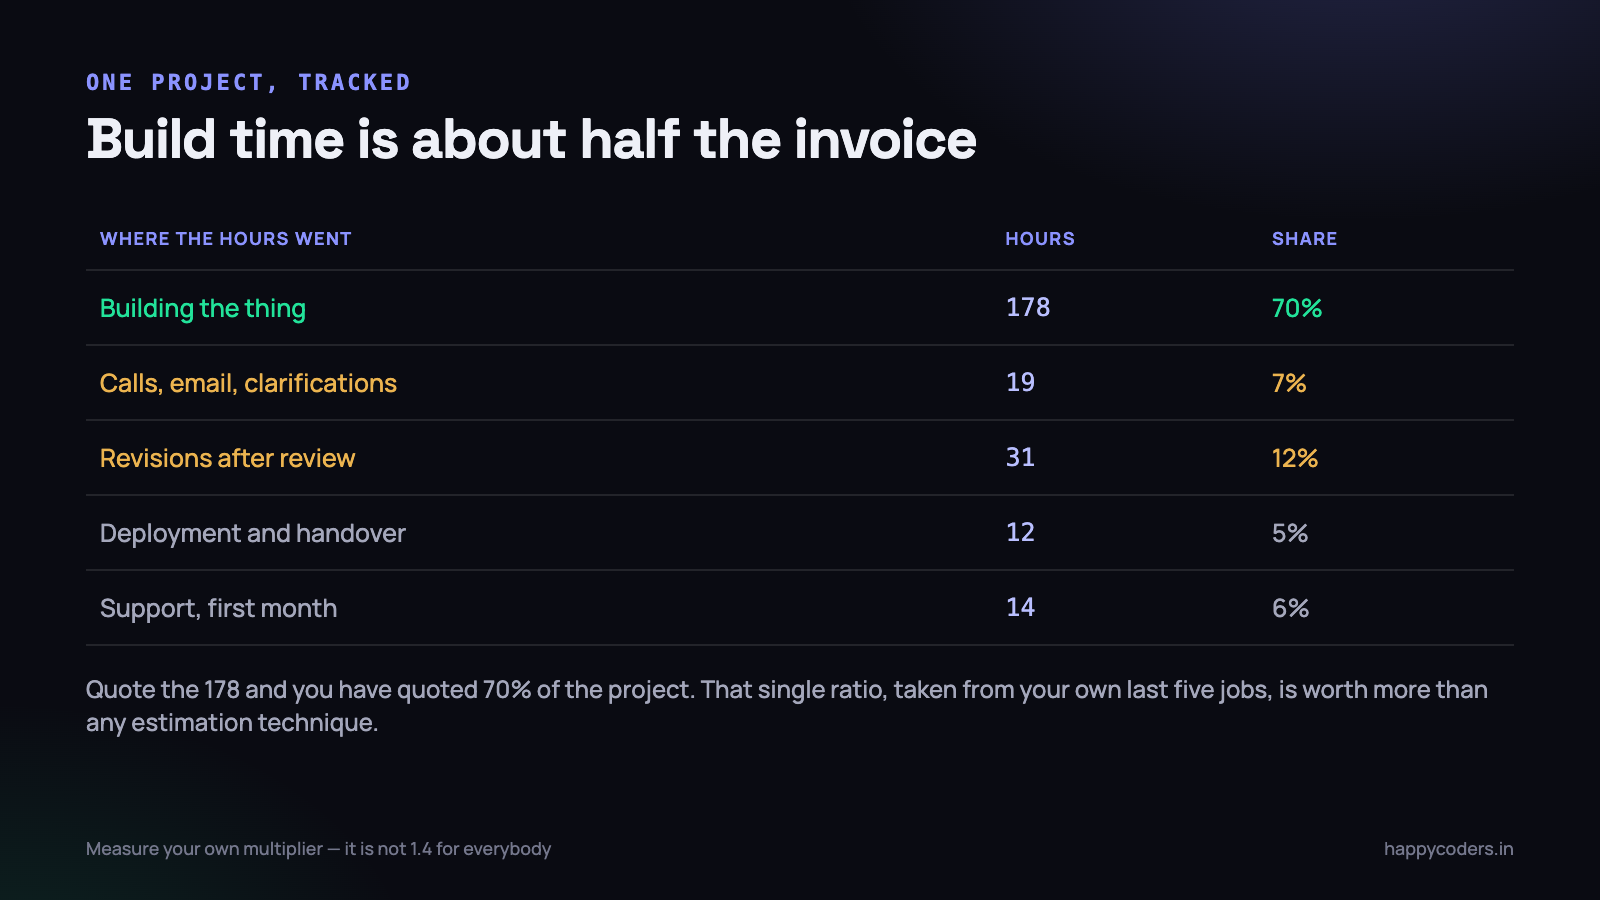
On a typical mid-size project for an Indian SME client, roughly 70% of the hours are building and 30% are everything else. On a project with an inexperienced client, or a committee making decisions, or an unfamiliar third-party integration, the build share drops towards 55%. On a repeat project for a client you know well, it climbs to 80%.
This means that when you quote 178 hours of build work, you have quoted about 70% of the project. Your multiplier is roughly 1.4. If you have been quoting the build number and wondering why margins are thin, you have just found the arithmetic.
Calculate your own multiplier, not ours
Do not take 1.4 as gospel. The number varies enormously by the kind of work and the kind of client, and the entire point of this exercise is that you have the data to compute your own. The calculation is four steps.
- Pick five completed projects from the last year that you would take again. Not the disasters, not the dream jobs — the normal ones.
- Pull the total tracked hours for each, including every hour any person logged against it.
- Pull the hours logged against build tasks only, excluding meetings, revisions, deployment and support.
- Divide total by build. Do it per project, then look at the five numbers. If they cluster, you have your multiplier. If they scatter, the spread itself tells you which kind of project is risky.
That fourth point matters. A tight cluster means you can quote from the build estimate with confidence. A wide spread — one project at 1.2 and another at 2.1 — means something about the client or the work varies hugely, and your job is to identify the variable and put it in the assumptions rather than in the number.
Building a library of what work actually took
A multiplier corrects your estimates. A library replaces them.
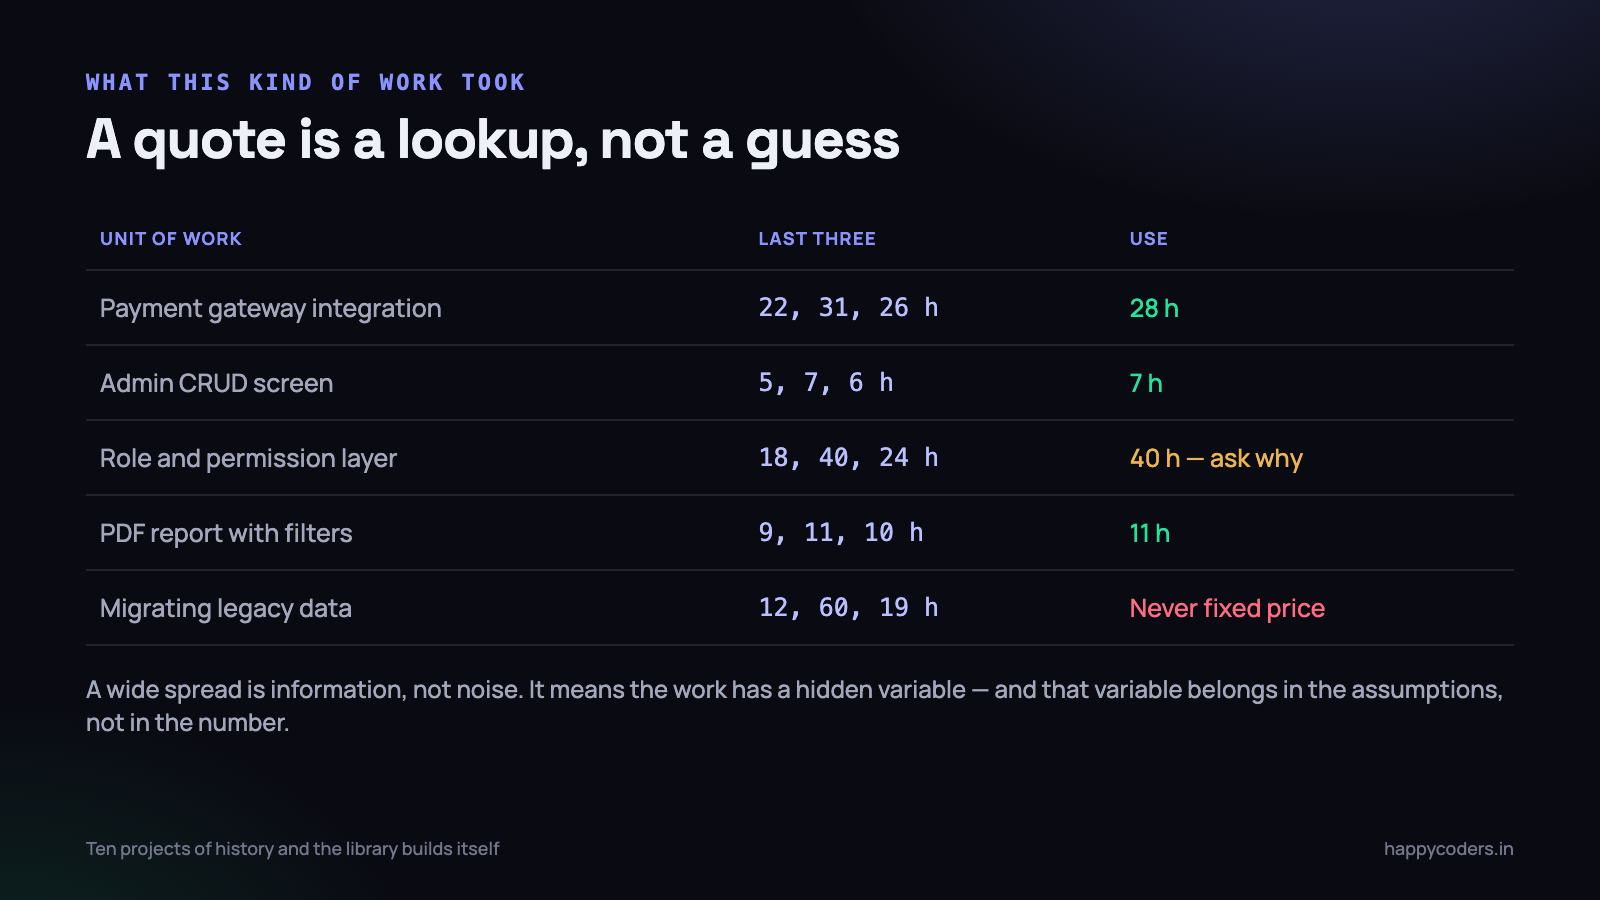
The idea is straightforward: instead of imagining how long a payment gateway integration will take, look up how long the last three payment gateway integrations took. Instead of guessing at an admin screen, find out that your last eleven admin CRUD screens averaged six hours.
How to build one without a project to run it
You do not need a taxonomy committee or a new process. You need task names that are consistent enough to search, and enough history to average.
- Name tasks by the unit of work, not the client. “Razorpay integration” rather than “Sharma sir payment thing”. Six months from now you will search for the first and find nothing for the second.
- Keep the units small enough to recur. “Build the admin panel” happens once. “Admin CRUD screen” happens forty times, which is what makes it an average.
- Record the spread, not just the mean. Three integrations at 22, 31 and 26 hours tell you to quote 28. Three at 18, 40 and 24 tell you something is unstable and you should quote 40 and find out why.
- Note the shape of the client. Two hours spent tagging projects as first-time or repeat, single decision-maker or committee, will explain more variance than anything else you record.
- Do not tidy history. The 60-hour data migration that went wrong is the most useful row in the table. Deleting it because it was unrepresentative removes the exact information you need.
After about ten delivered projects the library starts answering questions on its own. After thirty, quoting becomes a genuinely different activity — you assemble a figure from known parts rather than producing one from conviction.
What the tracked data has to look like for this to work
Time data that only records “8 hours, Project Sharma” cannot build a library. You need hours attached to tasks, not just projects, and that is the one habit worth enforcing.
This is also where the difference between a timesheet and real tracking shows up. A weekly timesheet written on Friday afternoon gives you a total that is roughly right and a distribution that is not, because the hours nobody remembers get reassigned to whatever they do remember. That is fine for payroll and useless for estimating, which is precisely the point made in our piece on timesheets versus time tracking.
In Happy Tracker terms, the reports that feed this are the project report and the task-level breakdown — hours per project, hours per task, hours per person, filterable by date range or sprint, exportable. That is enough. You are doing the analysis in a spreadsheet once a quarter, not asking software to do it for you.
Be clear about what tracked hours can and cannot tell you. They tell you how long work took. They do not tell you whether it was profitable — that needs rates and costs joined to the hours, which is a separate exercise. We wrote about that in how to calculate project profitability. Hours are the input; margin is a calculation you still do yourself.
Adding a contingency you can actually defend
Everybody adds padding. Almost nobody can explain it, which is why it collapses under the first round of negotiation.
When a client asks why the number is what it is and the honest answer is “I added twenty per cent for safety”, you lose the twenty per cent. When the answer is “this includes two rounds of revisions, which on our last five projects of this type averaged 31 hours”, the conversation is completely different. You are not padding. You are pricing a known component.
Three kinds of contingency, priced separately
- Known unknowns you have measured. Revisions, meetings, deployment. These are not contingency at all — they are line items, and your history gives you the hours. Put them in the scope.
- Specific risks in this project. An API you have not used. A data migration from a system nobody can describe. Price these individually and say so: “the migration is quoted at 20 hours on the assumption the export is CSV; if it is a database dump we will re-estimate”.
- General uncertainty. What is left. 10% is reasonable on familiar work, 20% on unfamiliar. This is the only part that is genuinely a buffer, and because you have separated it out it is now small enough to survive a negotiation.
The discipline of separating them changes client conversations. A single unexplained 30% is a target. Three explained components, one of which is 10%, is a quote.
Quote a range, and attach the conditions
A single number reads as a promise. The client hears a commitment; you meant a best estimate; and every subsequent change becomes an argument about who is at fault.
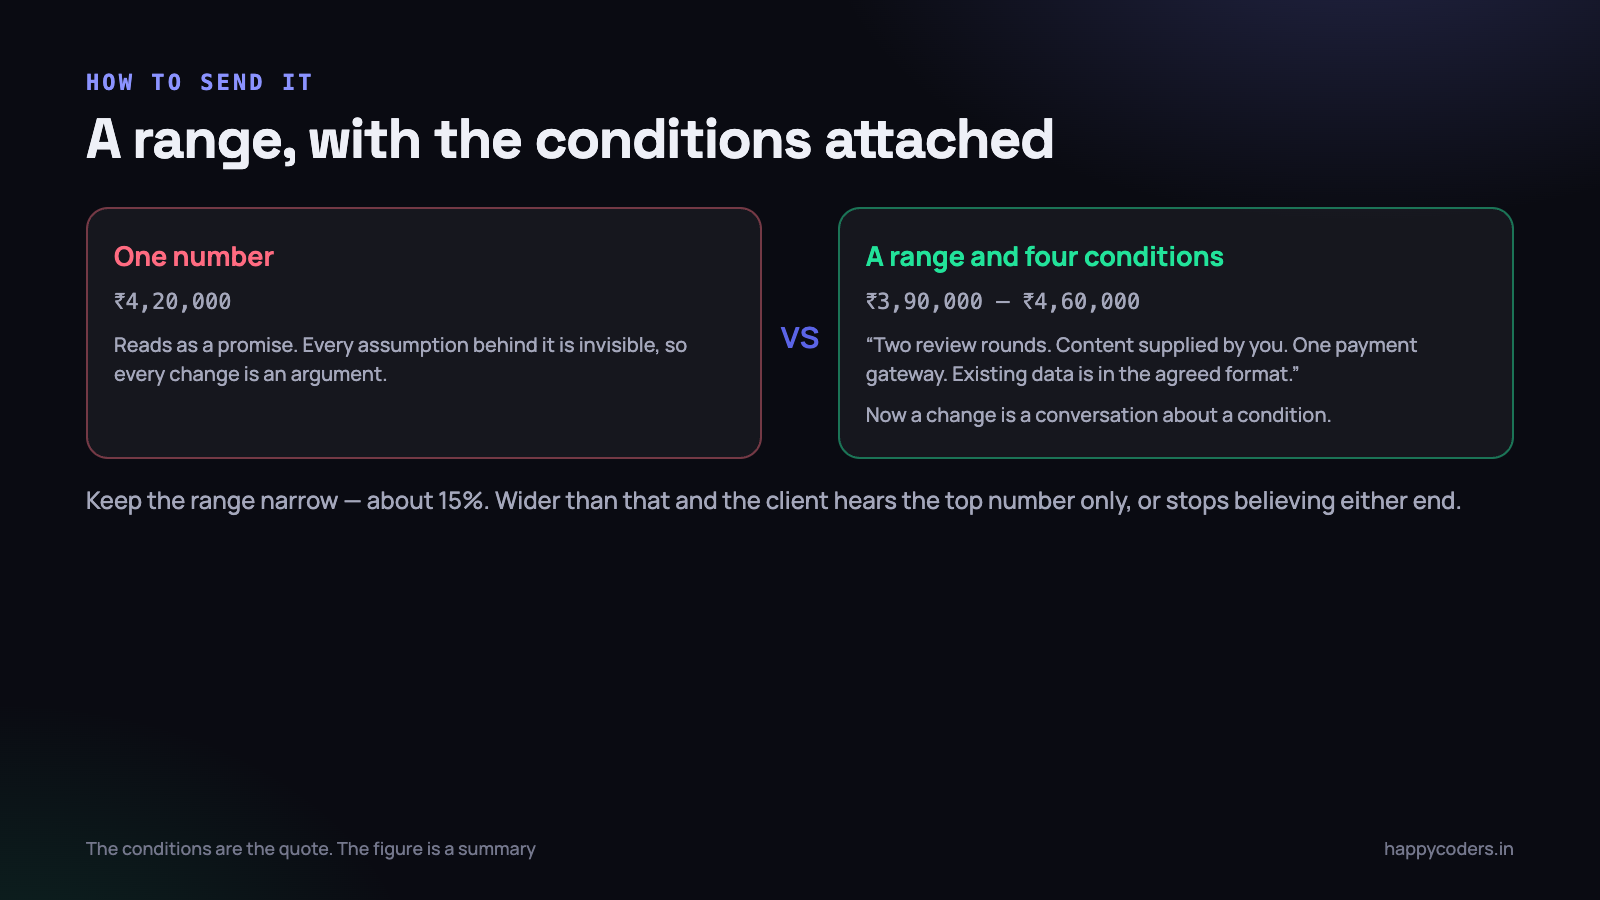
Quote a range instead, and keep it narrow — around 15%. Wider than that and the client either hears only the lower number or stops believing the estimate has any basis. ₹3,90,000 to ₹4,60,000 is a range. ₹3,00,000 to ₹6,00,000 is an admission that you do not know.
Then attach the conditions, because the conditions are the actual quote. The figure is a summary of them.
- What is included, in units. Two rounds of revisions per deliverable. One payment gateway. Up to six user roles. Numbers, not adjectives.
- What the client supplies, and by when. Content, logos, API credentials, a named person who can make decisions. Most overruns that look like scope creep are actually waiting.
- What is explicitly out. Hosting, third-party licences, content writing, training beyond one session, support past the first thirty days.
- What happens if a condition fails. “A third review round is billed at ₹1,500 per hour” is a sentence you will be grateful for in month three, and one the client is far more willing to accept before the project than during it.
Writing this in the quote is not defensiveness. It gives the client a genuine choice about scope while they still have one, which is what they wanted anyway.
Quote in phases, so being wrong is survivable
One number for a four-month project is a bet placed in week zero on information you will not have until week six. Splitting the same quote into phases does not make the estimate more accurate, but it changes what happens when it is wrong.
Three or four phases is usually enough — discovery and design, core build, integrations, then launch and handover. Each gets its own hours from the library and its own conditions. The client sees the same total, so nothing is lost commercially.
What you gain is a checkpoint. At the end of phase one you can compare quoted against actual for that phase alone, and the comparison is available in week two rather than week nine. If discovery took thirty hours against a quote of eighteen, you now know something important while there is still time to act on it: you can raise it with the client, adjust the later phases, or tighten the conditions before the expensive part starts.
Phasing also does something for the person building. A four-month project with one deadline has no meaningful progress signal until it is nearly over, which is how a project quietly slips for two months. Four phase boundaries produce four honest moments where somebody has to say whether the plan still holds.
Do not confuse phases with milestones for payment, although they usually align. A payment milestone is a commercial instrument. A phase is a measurement point, and it is worth having even on projects billed monthly.
Close the loop, or none of it improves
The whole system depends on one habit that takes twenty minutes and almost never happens: when a project ends, compare what you quoted with what it took.
Open the quote. Open the time report. Write down three numbers — quoted hours, actual hours, and the ratio. Then write one sentence about where the difference came from. Not an analysis. One sentence. “Client changed the reporting requirement in week six, which cost 24 hours.”
Do that for a year and you will have something no estimation methodology can give you: a record of how your company is specifically wrong. Perhaps you consistently underestimate anything involving a third-party API. Perhaps your revision rounds run double on projects sold by one particular person. Perhaps everything you quote for repeat clients is fine and everything for new clients overruns by 40%.
Those are not general truths about software estimation. They are facts about your business, and each one is worth money the moment you know it.
When a fixed price is the wrong instrument
Some work cannot be quoted from history because it has no history and no stable shape. Trying anyway is how firms lose a quarter.
- Data migration from a system nobody can describe. Quote the investigation as a small fixed piece, then quote the migration once you have seen the data.
- “Make it faster” performance work, where the problem is unknown until you profile it.
- Integrations with an undocumented or internal client API. The variance is entirely on their side.
- Anything where the client cannot name a decision-maker. The spread on your library rows for committee projects will already have told you this.
For these, a paid discovery phase is not a sales tactic. It converts the unknowable part into a small, bounded piece of work that produces an estimate for the rest — and the client gets a real number instead of a hopeful one.
What to do on Monday morning
- Pick your last five delivered projects and pull total hours and build-only hours for each.
- Calculate the ratio for each. Write the five numbers on one line. That line is your multiplier and your variance.
- List the six units of work you sell most often — the integration, the admin screen, the report, whatever they are for you.
- Look up the last three of each in your time data and write down the hours. That is the first version of your library, and it took an afternoon.
- Rewrite one quote you are about to send using a range and four written conditions instead of a single number.
- Put a recurring twenty-minute slot in the calendar for the end of every project: quoted, actual, ratio, one sentence.
The sixth step is the one that compounds. Everything else is a single improvement; that one makes next year’s quotes better than this year’s, automatically, for as long as you keep doing it.
Happy Tracker records hours against projects and tasks, per person, with exportable project and sprint reports — which is the raw material this whole method runs on. The analysis stays yours, in a spreadsheet, which is where it belongs.