A forty-hour week, five developers, two hundred hours of capacity. At the end of the month you invoice for four hundred and eighty hours instead of eight hundred. Where did the other three hundred and twenty go?
That question is what billable utilisation answers. It is one of the few numbers that tells a services business something true about itself, and it is also one of the easiest to turn into a weapon. This article covers the formula, what the number should be, what the non-billable portion is actually made of, why utilisation and profitability are different questions, and how to use it without teaching your team to lie to the timesheet.
The formula, and the part everybody gets wrong
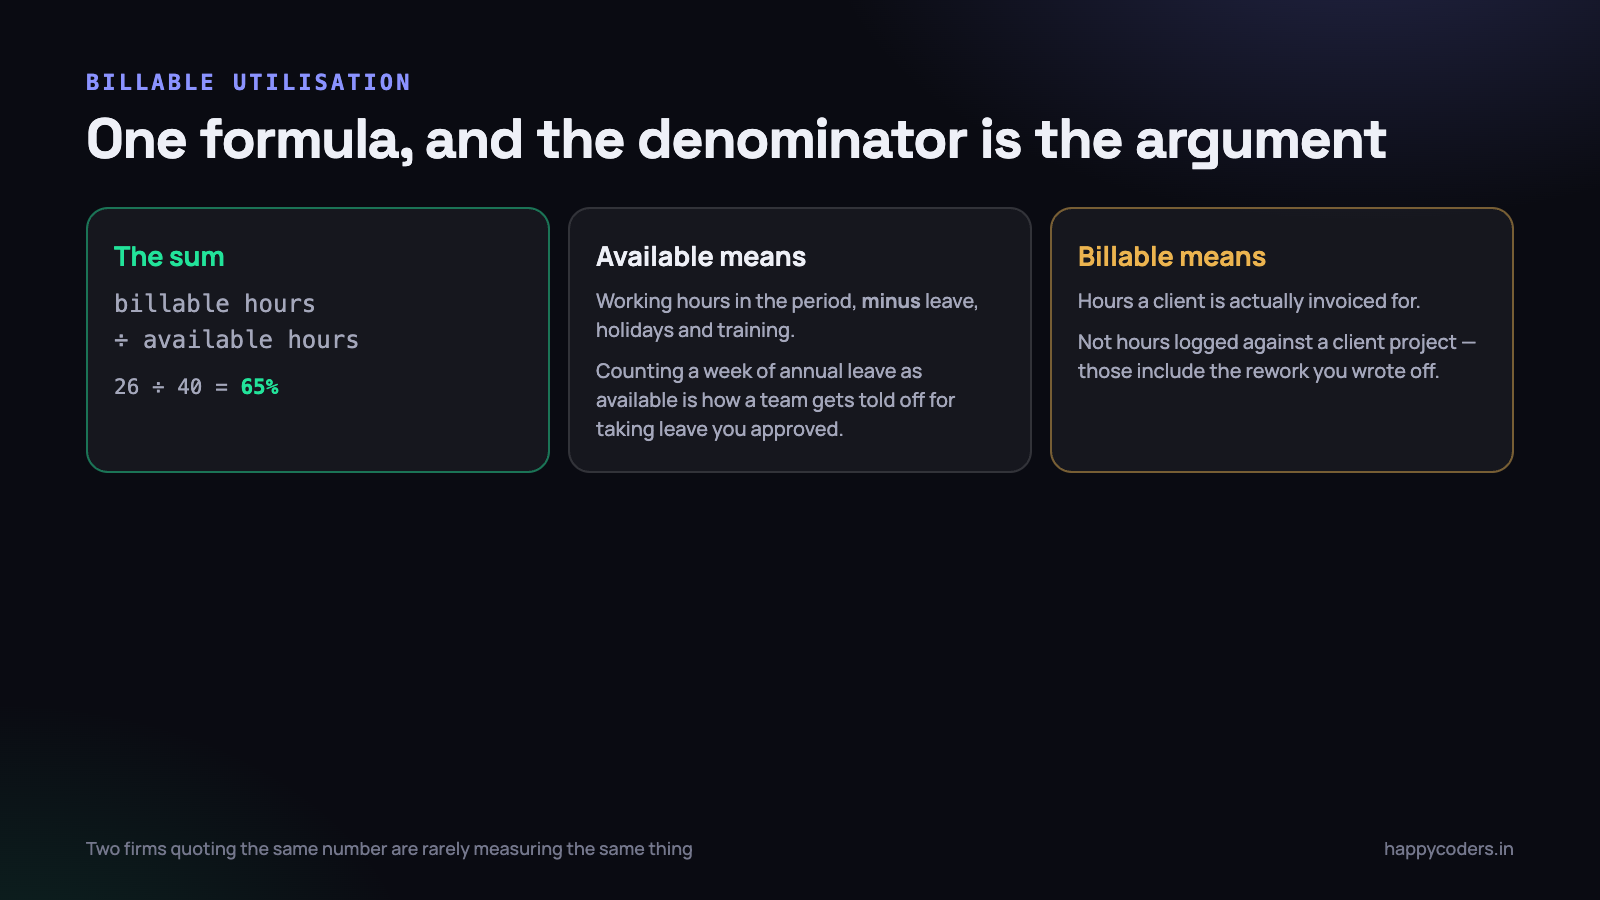
Billable utilisation is billable hours divided by available hours, expressed as a percentage. A developer who bills twenty-six hours in a forty-hour week is at 65%.
The formula is trivial. The definitions are not, and two companies quoting the same utilisation figure are frequently measuring completely different things.
Available hours
Available means the working hours in the period minus leave, public holidays, and time you have formally allocated to something else such as a training week.
Counting approved annual leave as available time is the most common mistake and the most damaging. A person who takes a week off in a four-week month has their utilisation drop by a quarter through no decision of their own. Do that and you have built a metric that punishes people for taking leave you granted, and they will notice within one cycle.
The clean version: if somebody was at work and able to do work, the hour is available. If they were on approved leave or it was Diwali, it is not.
Billable hours
Billable means hours a client is actually invoiced for. This is narrower than “hours logged against a client project”, and the gap between the two is worth watching on its own.
If a developer logs thirty hours to a client project but you invoice twenty-six because four were rework you decided not to charge for, then billable is twenty-six. The four written-off hours are real, they cost real money, and hiding them inside the billable figure conceals exactly the problem you would want to find.
Track both numbers if you can: hours logged to client work, and hours invoiced. The difference is your write-off rate, and a rising write-off rate is an early warning of scope, quality or estimating trouble — usually months before it shows up in the bank balance.
A worked example
Take a five-person team in a month with twenty-two working days and eight-hour days. Gross capacity is 880 hours. One person takes four days of leave and there is one public holiday for everybody, which removes 72 hours. Available hours are 808.
The team logs 612 hours against client projects, of which 41 are written off as rework. Billable hours are 571. Utilisation is 571 divided by 808, which is 71%.
Note what that number is not. It is not an accusation about the 237 hours that were not billed. Some of that was a proposal that won a ₹12 lakh project. Some was two days of interviews. Some was a developer fixing your own deployment pipeline. Read on before deciding any of it was waste.
What a realistic target actually looks like
For an Indian services team — an agency, a software development company, a consultancy — 65% to 80% is the realistic band, and most healthy teams sit around 70% to 75%.
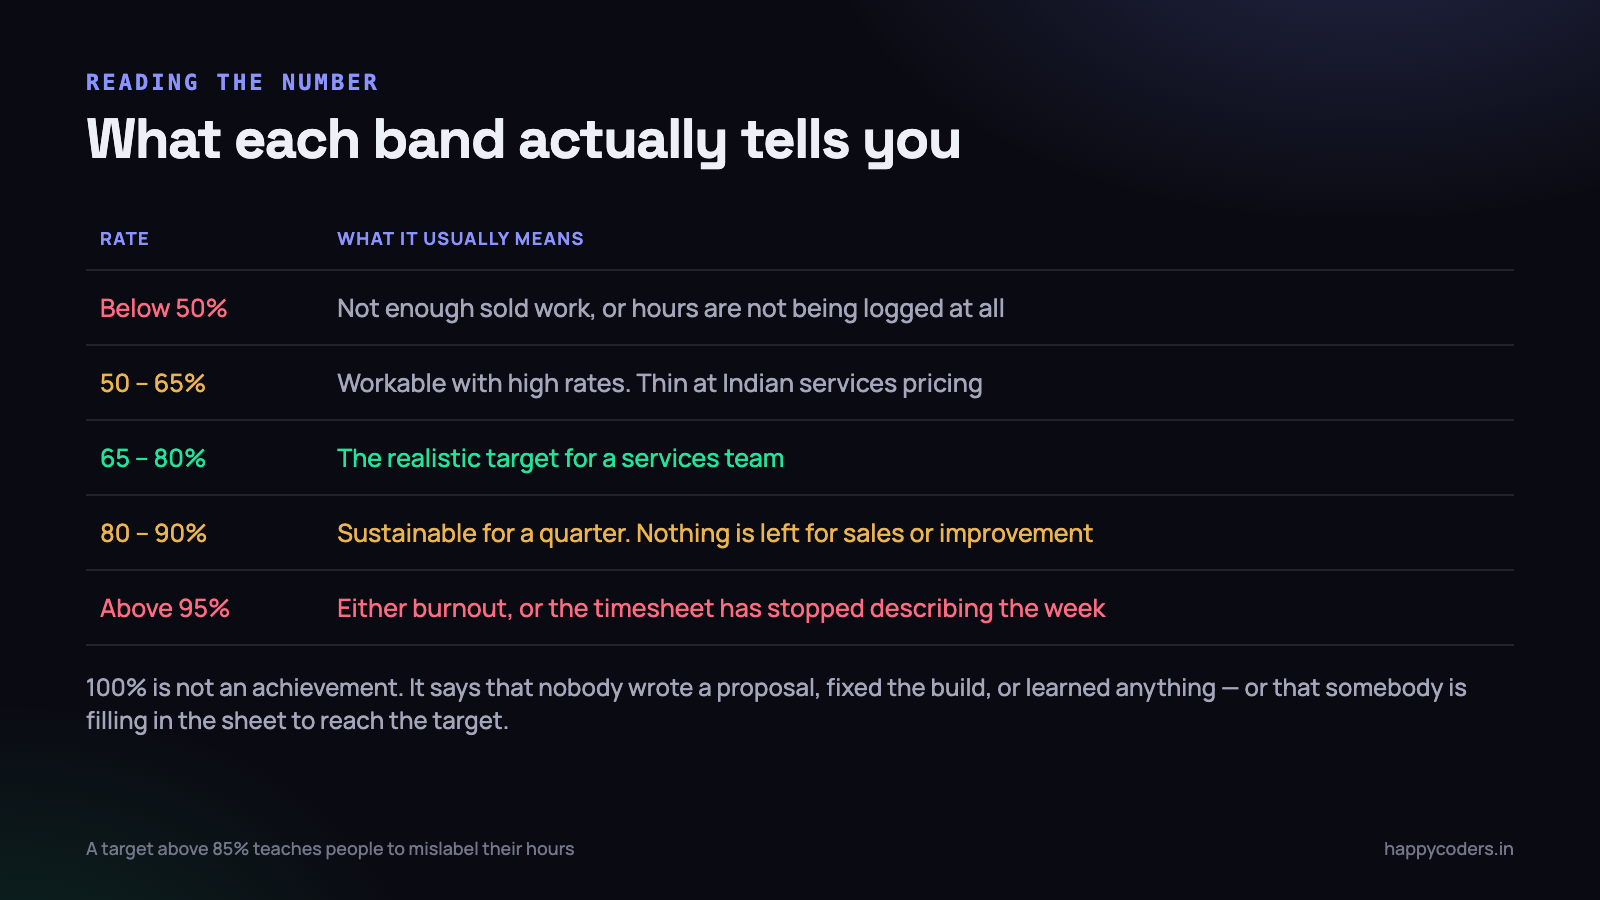
Here is how to read where you land.
- Below 50%. Either there is not enough sold work, or hours are not being logged at all. Check the second before concluding the first — a team that logs six hours of a nine-hour day produces this number whatever the sales pipeline looks like.
- 50% to 65%. Workable if your effective rate is high. At typical Indian services pricing it is thin, and worth a serious look at the pipeline and at how much time is going into rework.
- 65% to 80%. The target. Enough billed work to be comfortably profitable, and enough slack left for sales, hiring, learning and fixing your own systems.
- 80% to 90%. Sustainable for a quarter when a big project lands. Sustained for a year, it means nobody is writing proposals or improving anything, and you are borrowing from next year to pay for this one.
- Above 95%. Something is wrong. Either people are working far longer than they should be, or the timesheet has stopped describing the week.
Why 100 per cent is a red flag
It should be arithmetically obvious and it is still chased constantly. If every hour of every week is billed to a client, then nobody wrote the proposal for next quarter’s work, nobody interviewed the candidate, nobody fixed the build that breaks every Thursday, and nobody learnt the framework you will be selling next year.
A firm at 100% utilisation has full order books today and nothing scheduled for the day after the current projects end. That is not efficiency. It is a business consuming its own future capacity to look busy.
There is a second, worse possibility. When a target is set at or near 100%, people meet it. They meet it by logging the proposal hour as client work, by counting a standup as project time, by writing eight billable hours into a day that contained five. The number goes up, the information goes to zero, and now you cannot estimate, cannot quote and cannot see a problem coming. A target above about 85% reliably produces this, and the damage is invisible precisely because the metric looks healthy.
The other 30 per cent is not waste
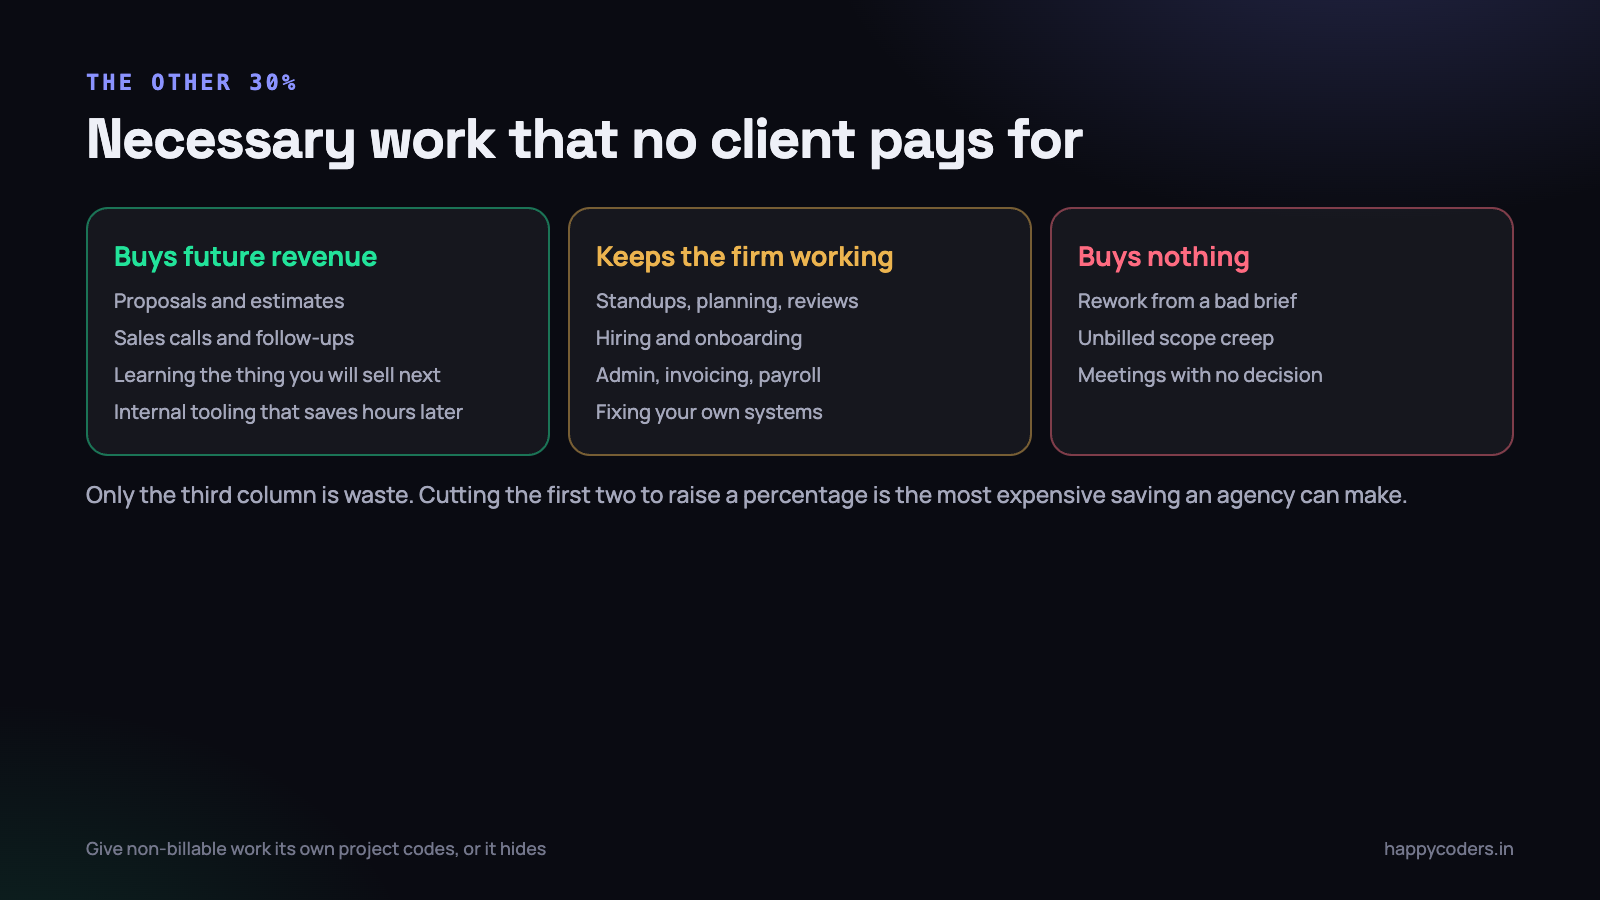
The instinct on seeing a 70% figure is to ask how to get it to 85%. The better question is what the 30% is made of, because it contains three completely different kinds of thing and only one of them should be cut.
Work that buys future revenue
Proposals, estimates, sales calls, discovery conversations, learning the technology you will sell next year, building internal tooling that removes ten hours a month from every project. These hours have a return; it simply arrives later and lands on a different project.
A firm that cuts this to raise utilisation has excellent numbers for two quarters and a serious problem in the third. This is the most expensive saving an agency can make, and it never looks like a mistake at the time.
Work that keeps the firm running
Standups, planning, retrospectives, code review, interviews, onboarding a new joiner, invoicing, payroll, fixing your own systems. None of it is billable and all of it is necessary. It also does not scale down — a team of ten spends proportionally more on coordination than a team of three, which is one reason utilisation tends to drift down as a company grows.
Work that buys nothing
Rework caused by a bad brief. Scope creep absorbed without an invoice. Meetings that end with no decision. Waiting because a client has not sent the content. Rebuilding something because the requirement was never written down.
This is the real target. It is also usually the largest single category in an agency that has never measured it, and it is invisible unless hours are logged against tasks rather than lumped into a project total. If you want a concrete place to start, count the hours in the last quarter that went into revisions after a deliverable was approved.
Give non-billable work its own project codes — Sales, Internal, Learning, Admin, Rework. Without them, everything non-billable collapses into one undifferentiated block and you cannot tell the investment from the waste. It costs nothing to set up and it is the difference between a number and a diagnosis.
Utilisation and profitability are different questions
This is the part that turns utilisation from a vanity metric into something useful. Utilisation asks how full the week was. Profitability asks what the week was worth. A team can score brilliantly on the first and lose money.
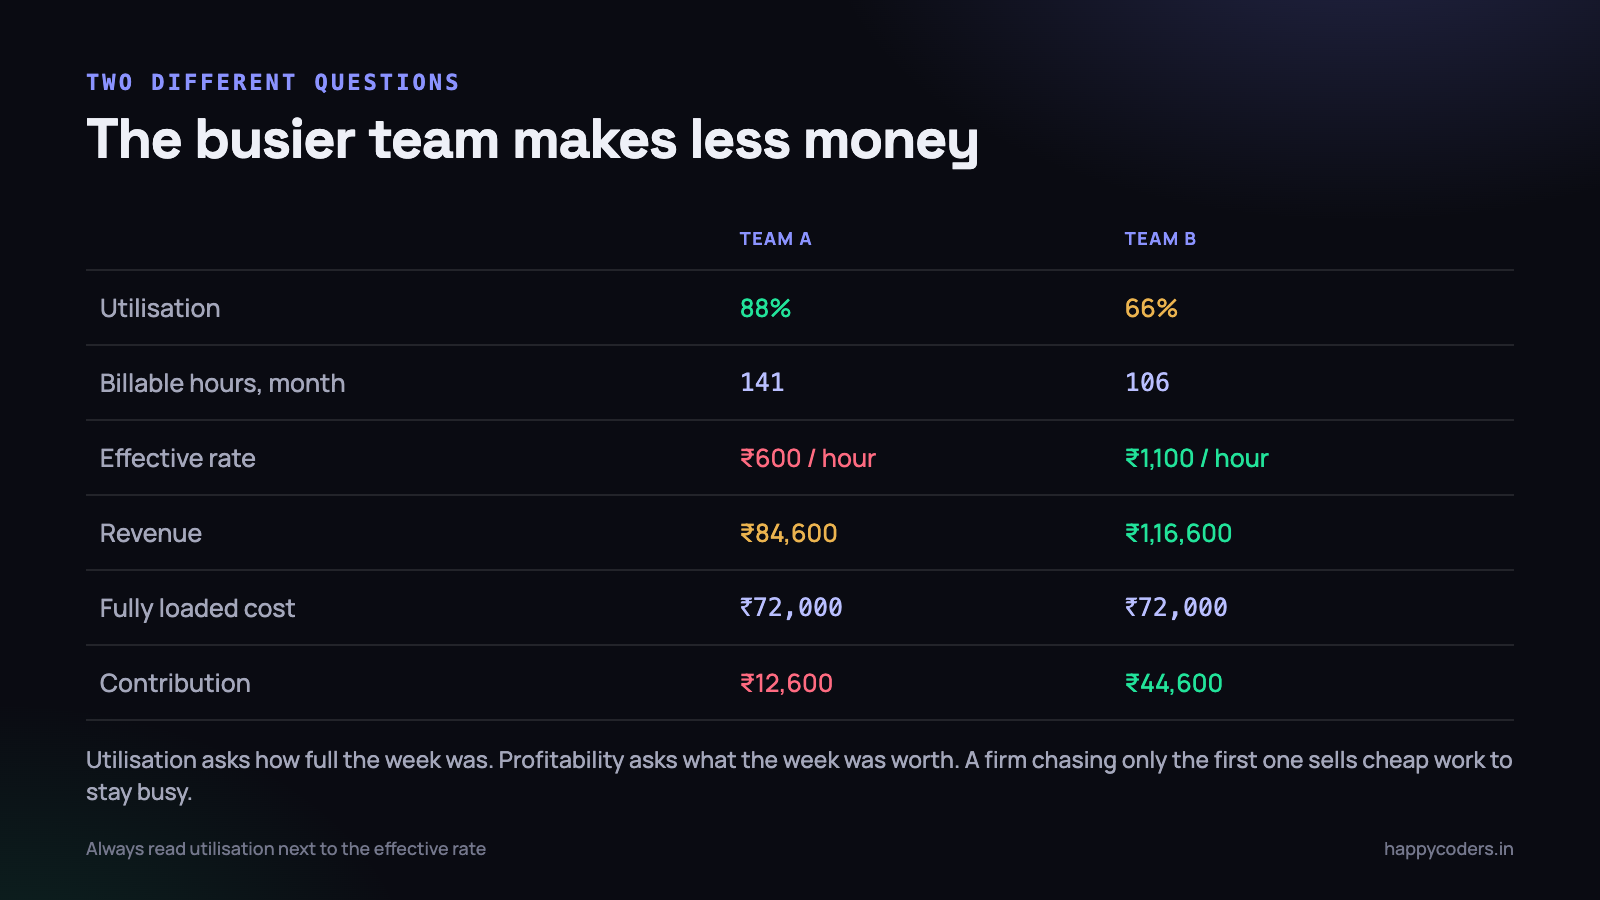
Take two teams of equal size and equal fully loaded cost of ₹72,000 per person per month — salary, plus the share of rent, software, hardware, admin and leave that person carries.
Team A is at 88% utilisation. In a 160-hour available month that is 141 billable hours, sold at an effective rate of ₹600 per hour on a fixed-price project that overran. Revenue per person: ₹84,600. Contribution after cost: ₹12,600.
Team B is at 66%. That is 106 billable hours at an effective rate of ₹1,100, because the work was quoted well and the client is one they understand. Revenue per person: ₹1,16,600. Contribution: ₹44,600.
Team B is less busy and three and a half times as profitable. If the only metric on the wall is utilisation, Team A looks like the model to copy, and a firm that copies it sells cheap work to stay busy and wonders why the bank balance never moves.
The effective rate is the missing number
Note that the rate in those examples is the effective rate — revenue divided by billable hours actually delivered — not the rate on the proposal. A fixed-price project quoted at ₹1,000 an hour that takes 60% longer than estimated was delivered at ₹625 an hour. The rate card says one thing; the timesheet says what really happened.
Always read utilisation next to the effective rate. Either one alone will mislead you. Together they tell you whether you have a sales problem, a pricing problem or a delivery problem, which are three very different things to fix. We went through the full calculation in how to calculate project profitability.
To be clear about our own product: Happy Tracker gives you the hours — per project, per task, per person, per sprint, exportable. It does not compute margin or produce a profitability report. Joining hours to rates and costs is a spreadsheet exercise you do once a month, and doing it by hand for a quarter is genuinely worth more than automating it, because you learn where your numbers actually come from.
How often to measure it, and at what size
Monthly, by team. Not weekly, and not by person.
A week is too short a window for this number to mean anything. One client delay, one release weekend, one person on leave, and a weekly figure swings twenty points for reasons that have nothing to do with how the business is doing. Reacting to that noise is how a sensible metric turns into a fortnightly interrogation.
A month smooths most of it out. A quarter is better still for deciding anything structural — whether to hire, whether the pipeline is thin, whether rework is trending up. Look at three consecutive months before drawing a conclusion, because one bad month is almost always a project, not a pattern.
Small teams and working founders
In a five- or ten-person Indian agency, the founder usually delivers as well as sells. Their utilisation will be low and should be, because the hours they are not billing are the hours that find next quarter’s work. Including them in a team average drags it down and tells you nothing useful.
Separate the two groups. Report utilisation for people whose primary job is delivery, and track the founder or principal’s billable hours as a separate line — one worth watching for the opposite reason. A founder whose utilisation climbs past 70% has stopped selling, and the effect of that arrives about four months later, all at once.
Reading the number without turning it into a stick
Utilisation is measured per person, which makes it dangerously easy to treat as a personal performance score. It is not one, and the moment a team believes it is, the data stops being true.
Four rules that keep it honest
- Report it by team and by month, not by person and by week. A week is noise. One person is a conversation that should happen privately, if at all.
- Never publish a ranked list. The person at the bottom is often the one who spent the week on a proposal, mentoring a new joiner, or the unglamorous internal work that keeps everything else running. Ranking teaches them not to do it again.
- Ask what the gap contains before asking why it exists. The first is a question about the business. The second is heard as an accusation, and it is answered with better-looking timesheets rather than better information.
- Separate the roles. A tech lead who reviews code and unblocks four people should have a lower target than a developer on a single project, and it should be written down as a target rather than discovered as a shortfall.
The underlying principle is the one that governs any metric attached to people: the moment a number becomes the thing being managed, it stops measuring what it measured. If you want a genuine picture of where the week went, the team has to believe that logging an honest six billable hours is safer than logging a tidy eight. That belief is worth more than any feature in any tracking product, and it is built or destroyed by what happens the first time somebody’s number looks bad.
It is also why the first report you circulate matters so much. A report about a project implicates nobody and starts a useful conversation. A report about people starts a different one, and the numbers inflate from that day onward. The same dynamic applies when introducing time tracking in the first place.
What to do on Monday morning
- Calculate last month’s figure for the whole team. Available hours minus leave and holidays, billable hours from the invoices, divide. One number, fifteen minutes.
- Calculate your effective rate for the same month — total client revenue divided by billable hours delivered. Write the two numbers next to each other.
- Create five non-billable project codes: Sales, Internal, Learning, Admin, Rework. Ask everyone to use them from the first of next month.
- Count last quarter’s rework hours specifically. This is the number most likely to change a decision, and almost nobody has it.
- Set a team target in the 70% to 75% range, and say out loud that the remaining quarter of the week is for sales, learning and keeping the company working.
- Decide now that you will never circulate a per-person ranking. Commit to it before the first month where somebody’s number looks bad, because that is when the decision actually gets made.
Do all six and by the end of next quarter you will know whether your problem is that you are not busy enough, or that you are busy at the wrong price. Those need opposite responses, and utilisation on its own cannot tell you which one you have.