Ask most agency owners how much capacity their team has next month and the answer is a number of people. “We have eight developers.” That number is wrong for planning in the same way that “we have eight cars” is wrong for planning a journey. It tells you nothing about how far any of them can actually go.
Capacity planning for a small team is not a discipline that needs software or a certification. It needs one sheet, three numbers per person, and the willingness to update it once a month. Teams that do it stop having the conversation where a project is three weeks late and nobody can explain why, because the answer — there were never enough hours — was visible in week one.
This post covers the three numbers, why headcount misleads, how to build the sheet, how to spot the person who is quietly at 130%, and what to do when sales has sold more than you have.
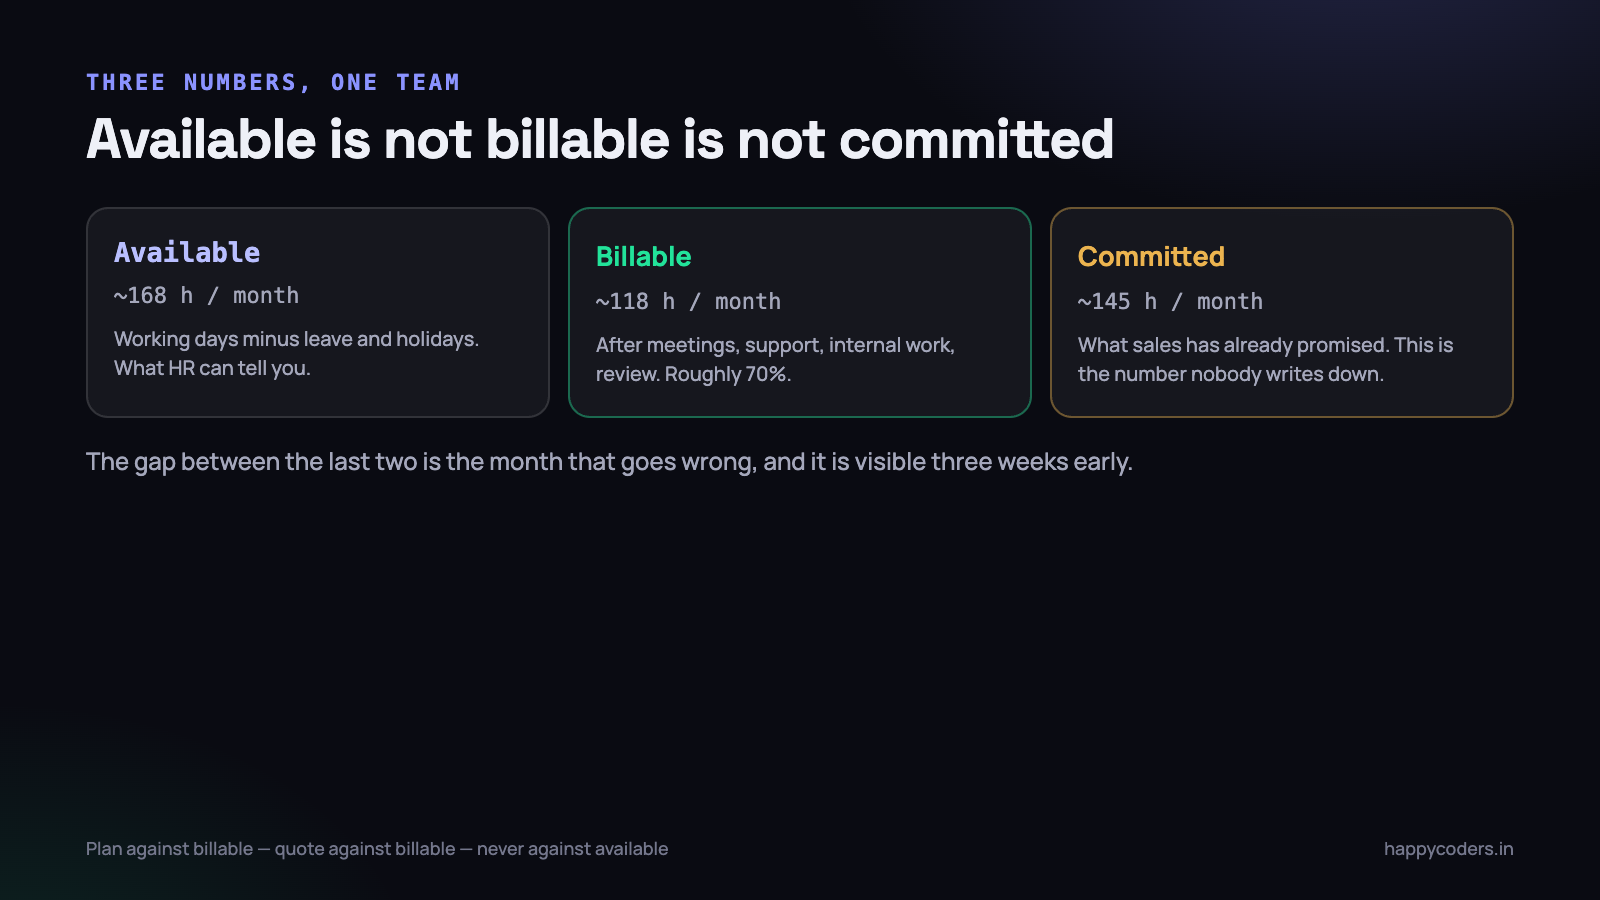
Available, billable, committed
Almost every planning mistake in a small team comes from using one of these three numbers where another one belongs.
Available hours
Working days in the month, minus public holidays, minus approved leave, times the working day. For September 2026 in Tamil Nadu that is roughly 21 working days, so 168 hours for a person with no leave booked.
This is the only number most companies can produce, because HR already tracks attendance and leave. It is also the number that is almost never useful on its own, because nobody spends 168 hours a month on client work and never has.
Billable hours
Available hours minus everything that is real work but not chargeable: internal meetings, code review, recruitment interviews, support for last year’s clients, the sprint planning session, the two hours lost when the office power went. For most Indian dev teams this lands between 60% and 75% of available.
This is the number that should drive every plan. A developer with 168 available hours and a 70% billable ratio has 118 hours of project capacity, not 168. Planning against 168 guarantees a 50-hour shortfall per person per month, which is exactly the size of gap that makes projects slip by weeks rather than days.
The ratio is not a guess. If you track time, you can calculate it from the last three months: billable hours divided by total logged hours, per person. We wrote this up in detail in the post on billable utilisation rate. Calculate it once a quarter and stop arguing about it.
Committed hours
Everything you have already promised somebody: signed projects, retainer blocks, the fixed-price job whose remaining work you estimated at 60 hours, the support commitment you never wrote down but honour anyway.
This is the number nobody maintains, because it lives in three places at once — the sales pipeline, the project plan, and somebody’s head. Until it is written down next to billable capacity, you are not planning, you are hoping.
Load percentage is committed divided by billable capacity. Anything over 85% for a month is a month with no room for a sick day, a production incident or a client who takes nine days to approve something. All three of those will happen.
Why headcount is a terrible capacity unit
Take a team of five people and ask what its monthly capacity is. Headcount says five developers, or 840 available hours. The real answer is usually less than half that, and the difference is not laziness.
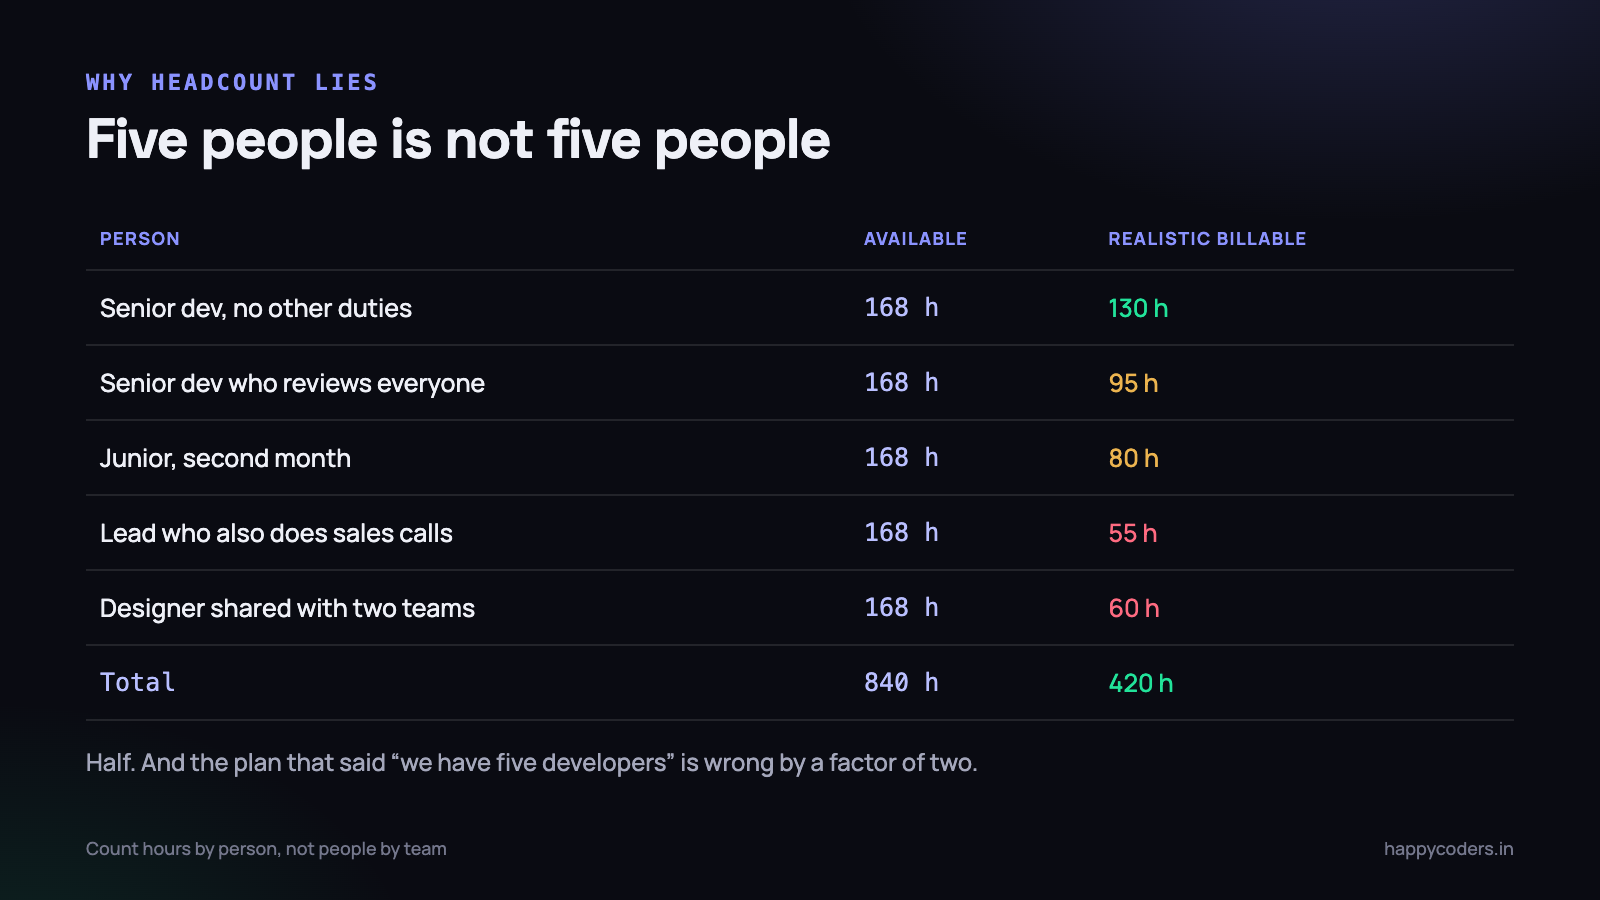
Look at where the hours actually go in a team that size:
- The senior who reviews everything. Every pull request in the team passes through one person. That is fifteen to twenty hours a month of genuinely valuable work that is invisible in every plan.
- The junior in month two. Producing real output, but at perhaps half the rate, and consuming senior time while doing it. Counting them as one unit overstates the team twice.
- The lead who also does sales. Two client calls a week, a proposal, a scoping session. A lead in a ten-person agency is often below 40% billable, and everyone still counts them as a full developer.
- The shared specialist. One designer across three projects spends real hours switching between them. A person split across three things is not three thirds.
- The person who holds the deployment knowledge. Interrupted every time anything breaks. Their calendar looks empty and their week is not.
This is why headcount plans fail in a specific, repeatable way: they are right about the total effort available and wrong about who can do what. The team really does have 840 hours. It has 420 hours of the specific kind of work the plan needs, and the shortfall lands on two or three people.
Building the sheet
A capacity sheet for a team under thirty is one tab in a spreadsheet, one row per person, refreshed on the first working day of each month. It takes about forty minutes the first time and ten minutes a month after that.
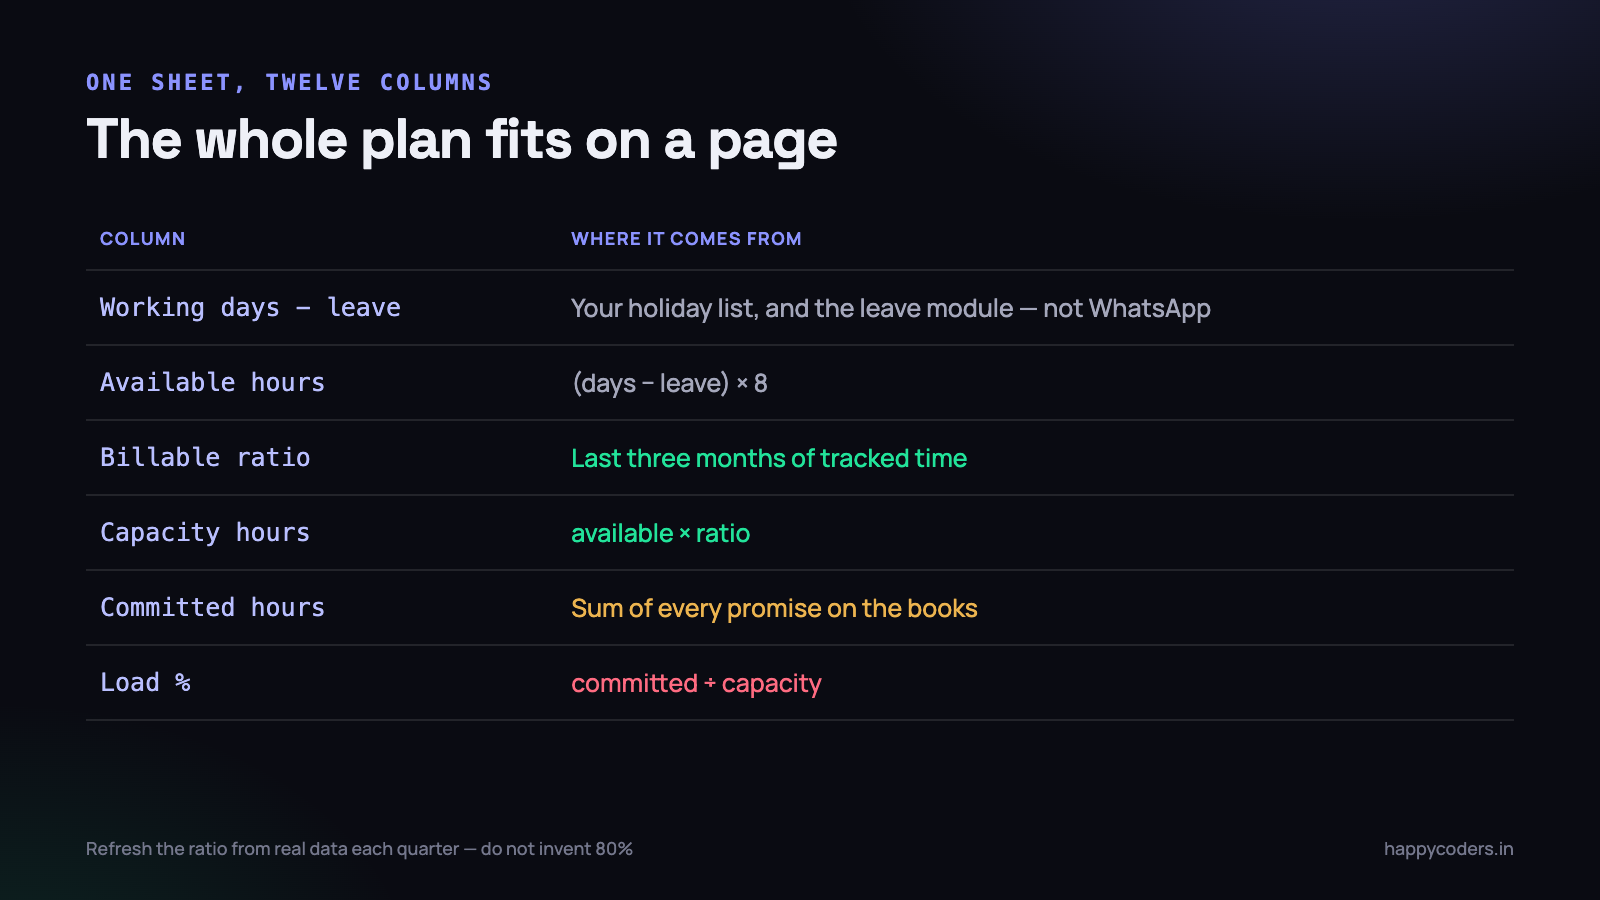
The columns, and where each number comes from:
- Working days — calendar days minus weekends minus public holidays. Use your actual holiday list, not a generic one; Pongal and Diwali land differently for different offices.
- Approved leave — from the leave system, in days. This is the number people fill in last and it is the one that moves the plan most.
- Available hours — (working days minus leave) times 8.
- Billable ratio — from the last three months of tracked time, per person. Not a team average: the lead and the junior are genuinely different.
- Capacity hours — available times ratio. This is the only number you should quote to sales.
- Committed hours — the sum of what is promised, broken out per project so you can see where it sits.
- Load — committed divided by capacity, as a percentage, conditionally formatted so that anything above 95% turns red without anyone having to read it.
Two rules keep the sheet honest. First, one person’s row is one person — do not let a contractor appear as 0.5 of somebody. Give them their own row with their own ratio. Second, the committed column must reconcile to something real. If a project’s remaining estimate is a number somebody made up in a meeting, the load percentage is fiction dressed as arithmetic.
What to do with the first version
The first time you build this sheet, the load column will look alarming. That is normal and it is the point. Most small teams discover they are running at 105% to 120% committed and have been for a year, absorbing the difference through unpaid overtime and slipped dates.
Do not try to fix it in week one. Show it to the people who make commitments — the founder, the sales lead — and agree one thing: no new commitment is made without checking this sheet. That single rule does more than any rebalancing exercise.
Spotting the person at 130% before they burn out
The most expensive event in a small team is not a late project. It is the resignation of the person everything routes through, which typically costs three to six months of reduced output and often takes a client with it.
That person almost never tells you. They are usually the one who says it is fine, they will manage, and they mean it right up until the day they stop meaning it.
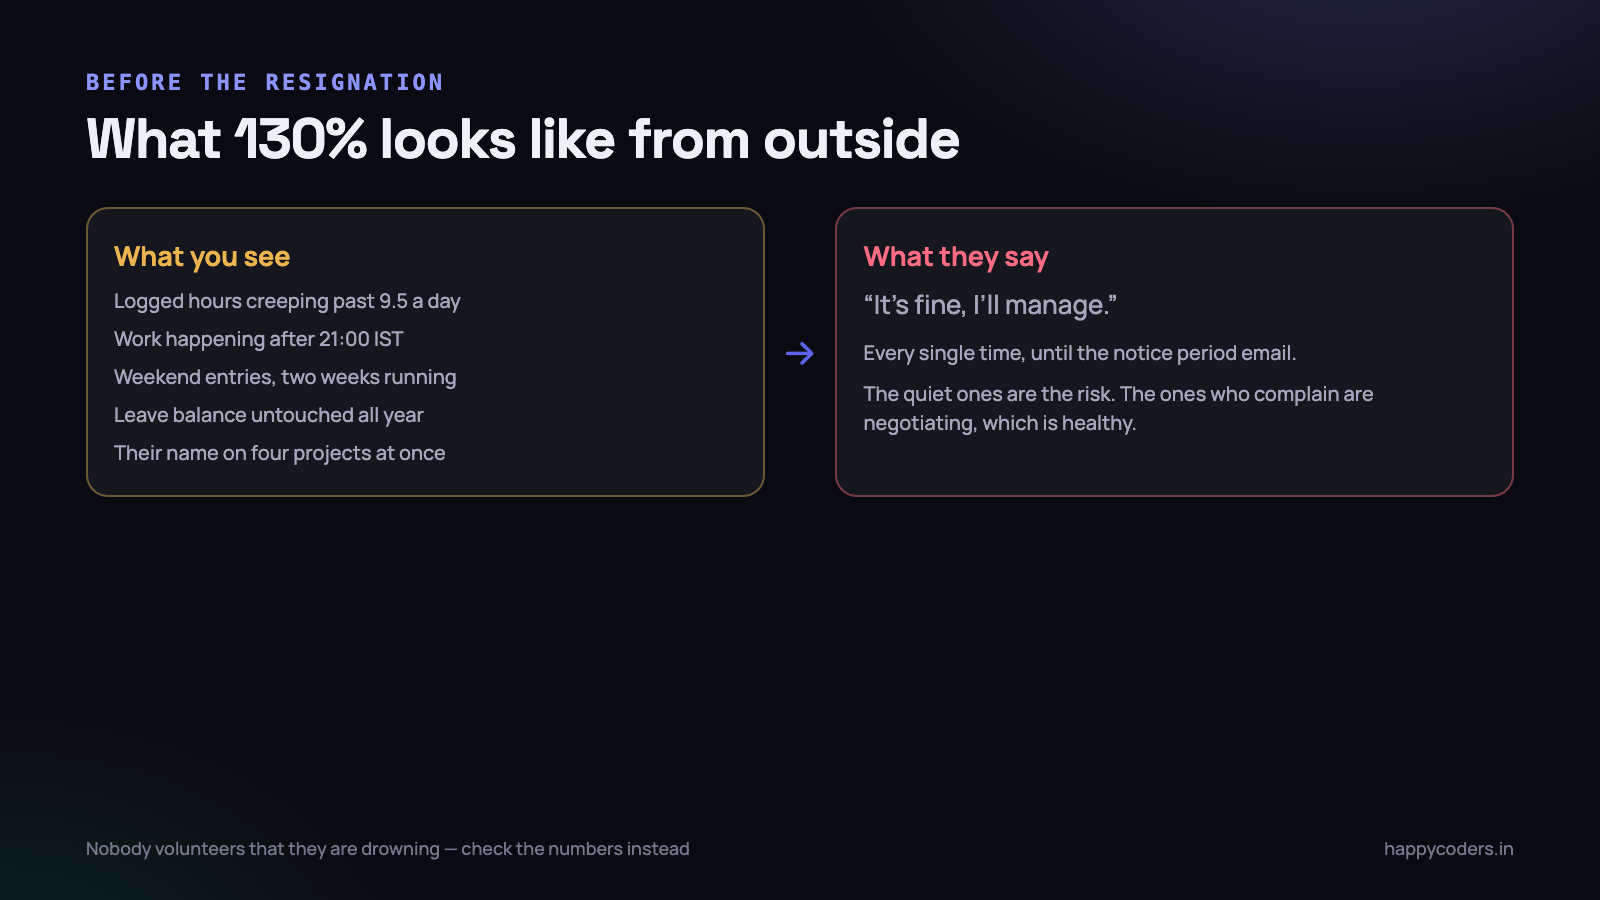
The signals are all measurable, and none of them requires watching anybody:
- Average logged day creeping past 9.5 hours over a fortnight. One long day is a deadline. Ten in a row is a structural problem.
- Work logged after 21:00 IST on more than a couple of evenings a week. Late work is sometimes a preference; late work every day is a queue that does not fit in the day.
- Weekend entries two weeks running. The second weekend is the signal, not the first.
- An untouched leave balance in month nine of the year. People who are drowning stop taking leave, because the work will still be there when they return and there will be more of it.
- Their name on four or more active projects. Context switching between four things has a real cost that no plan accounts for.
- A falling billable ratio with rising total hours. This is the classic overload signature: more time at the desk, less of it on the thing they are measured on, because the day is now made of interruptions.
Look at these numbers monthly, at the team level, and act on them privately. Pulling one person’s late-night hours into a group meeting is the fastest way to teach everybody to log their time dishonestly, and then you lose the signal entirely.
When you find someone at 130%, the intervention is not a conversation about resilience. It is a change to the sheet: take a project off them, move a date, or hire. A supportive chat that changes no numbers reads as being asked to keep going.
When sales sells more than capacity
This will happen. In a small company the person selling is usually the person who most wants to say yes, and the capacity sheet did not exist when the call happened. The question is only what you do in the week you find out.

Move a date
By an enormous margin the cheapest option, and the one that gets used last. A client told in week one that delivery moves from 30 September to 14 October is mildly annoyed. The same client told on 28 September is angry, and reasonably so, because they have made their own commitments around your date.
The cost of a date change is almost entirely a function of notice. Give the notice the day you see the number, not the day the deadline arrives.
Cut scope with the client, not quietly
If the date cannot move, the scope has to. Go to the client with a specific proposal: these four things ship on the date, these two move to phase two. Clients accept this far more often than agencies expect, because they usually have a launch requirement that involves three of the six things and they know which three.
What does not work is silently deprioritising something and hoping it is not noticed. It is always noticed, and it arrives as a quality complaint instead of a scope conversation.
Buy capacity properly
A trusted contractor at a known rate, engaged in week one, is a real option. A contractor engaged in week three of a four-week overrun is not — they will consume more senior time in onboarding than they produce. The rule is simple: contractors solve capacity problems you predicted, never capacity problems you are already inside.
Keep two or three people you have worked with before on a list with current rates, so that this decision takes a day rather than three weeks.
Overtime, capped and paid
One sprint, agreed out loud, paid or compensated with time off, with an end date everybody can see. That is a legitimate tool. Overtime as the standing plan is not a capacity strategy, it is a staff turnover strategy, and it stops working the moment somebody gets a better offer.
Leave and holidays are part of the plan, not a surprise
The most common single cause of a broken month in an Indian team is not scope creep. It is four people taking leave in the same fortnight, entirely legitimately, and nobody noticing until the second one was already approved.
This is completely preventable and costs almost nothing to prevent:
- One holiday calendar, published in January. Including the optional or restricted holidays your team actually takes. A plan built on a generic national list will be wrong every festival season.
- Leave approved in a system, not on WhatsApp. If approval lives in a chat thread, it is not in the capacity sheet, and it is also the thing that causes payroll disputes in March.
- A visible team calendar. The approver needs to see who else is out that week at the moment of approval, not afterwards.
- A cap per team per week. Two people out of an eight-person team is manageable. Four is a stopped project, and a simple rule stops it without anyone having their leave refused unfairly.
- Festival season planned in advance. Mid-October to early November is predictably thin every year. Plan the month at 70% and it works; plan it at 100% and it does not.
The setup for this is described in our post on leave types and the holiday calendar. The important part is not the tooling — it is that approved leave and the capacity sheet read from the same source, so one cannot quietly contradict the other.
What the numbers cannot tell you
A capacity sheet tells you whether the hours exist. It does not tell you whether the work is going well, whether the estimate was sensible, or whether a project is profitable. Happy Tracker gives you the inputs — hours by person and project, leave, the billable ratio — but the margin calculation still needs your rates and costs alongside those hours. Do not expect any tracking tool to hand you a profit number it was never given the data to compute.
It also will not tell you that a 90% load on one project is riskier than 90% spread across four small ones, or that your senior developer is bored. Those are judgements. The sheet exists so that you make them with the arithmetic already settled.
What to do on Monday morning
- Open a spreadsheet and put one row per person, with working days, approved leave and available hours. Twenty minutes.
- Pull the last three months of tracked time and calculate each person’s billable ratio. Do not use a single team-wide guess.
- Add the committed column: every project, every retainer, every promise with hours against it.
- Look at the load column and find anyone above 100%. Have a private conversation with each of them this week.
- Agree one rule with whoever makes commitments: nothing is promised without checking this sheet first.
- Put a recurring 30-minute slot on the first working day of every month to refresh it.
The sheet will be wrong in its details for the first two or three months, because the billable ratios settle only once you have real data. It will still be far more accurate than counting people, and it will already have told you something you did not know about who on your team is carrying too much.