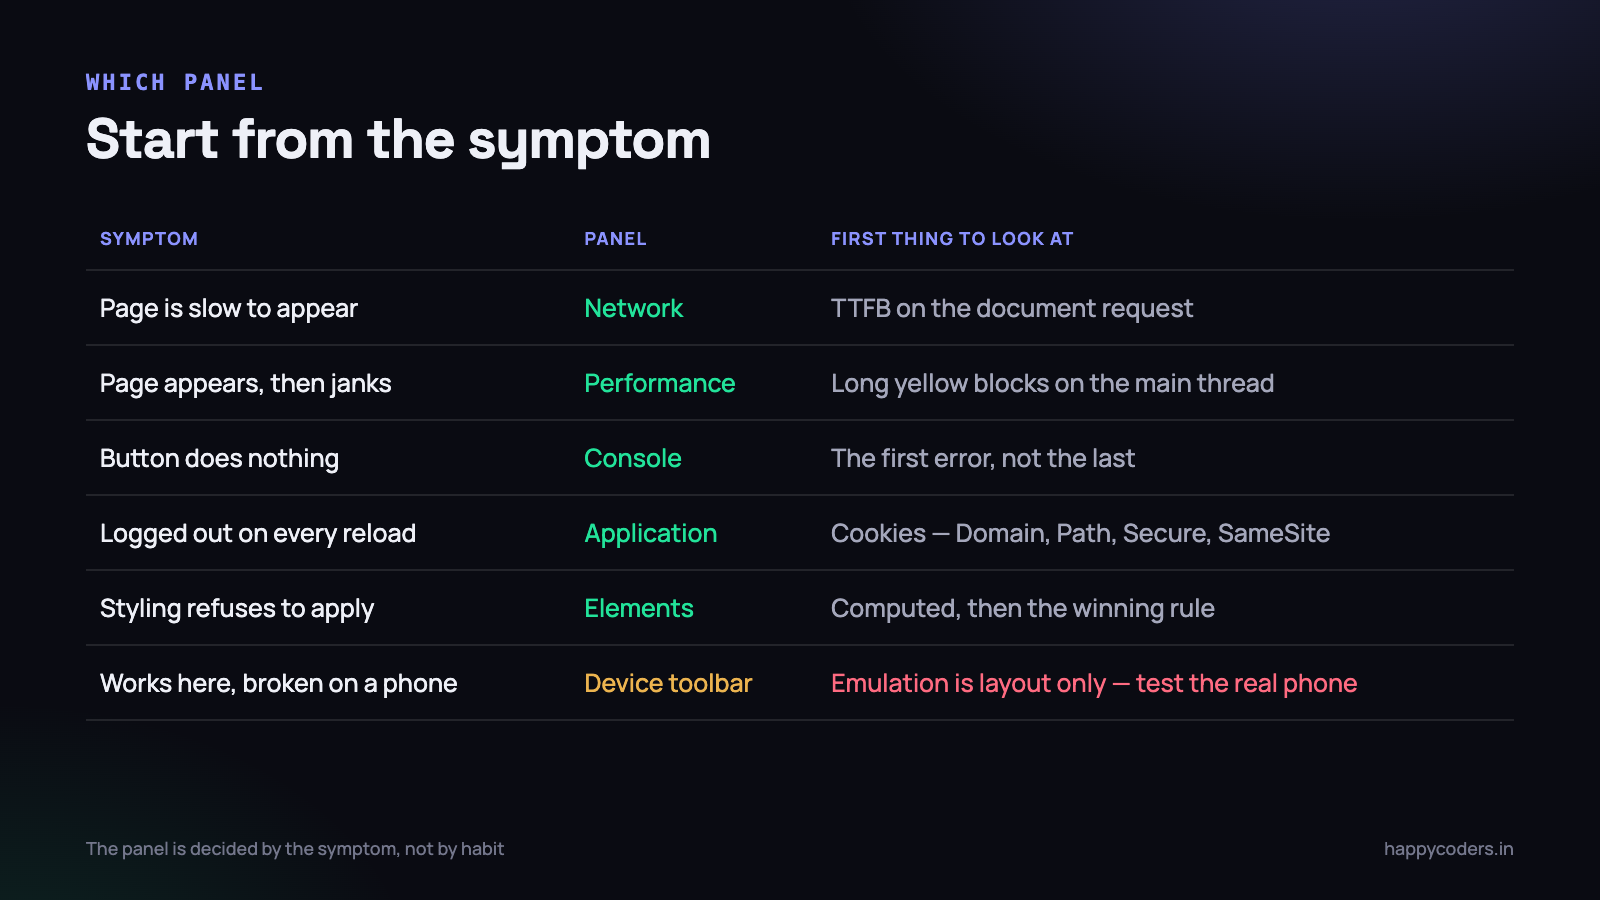
Nearly every developer opens DevTools several times a day and uses about a tenth of it. The Console for errors, the Elements panel to poke at a margin, and that is roughly where it stops. Meanwhile the answers to “why is this page slow”, “why does this style not apply” and “why does it work on my machine” are all sitting two clicks away.
This is the practical tour. Which panel answers which question, and the specific features that repay the five minutes it takes to learn them.
The Network tab, and the only four numbers that matter
Open Network, tick Disable cache, reload, and you have a complete record of everything the page fetched. The bar next to each request is not one number — hover it, or open the Timing tab, and it breaks into segments. Which segment is long tells you where the problem lives, and they lead to completely different fixes.
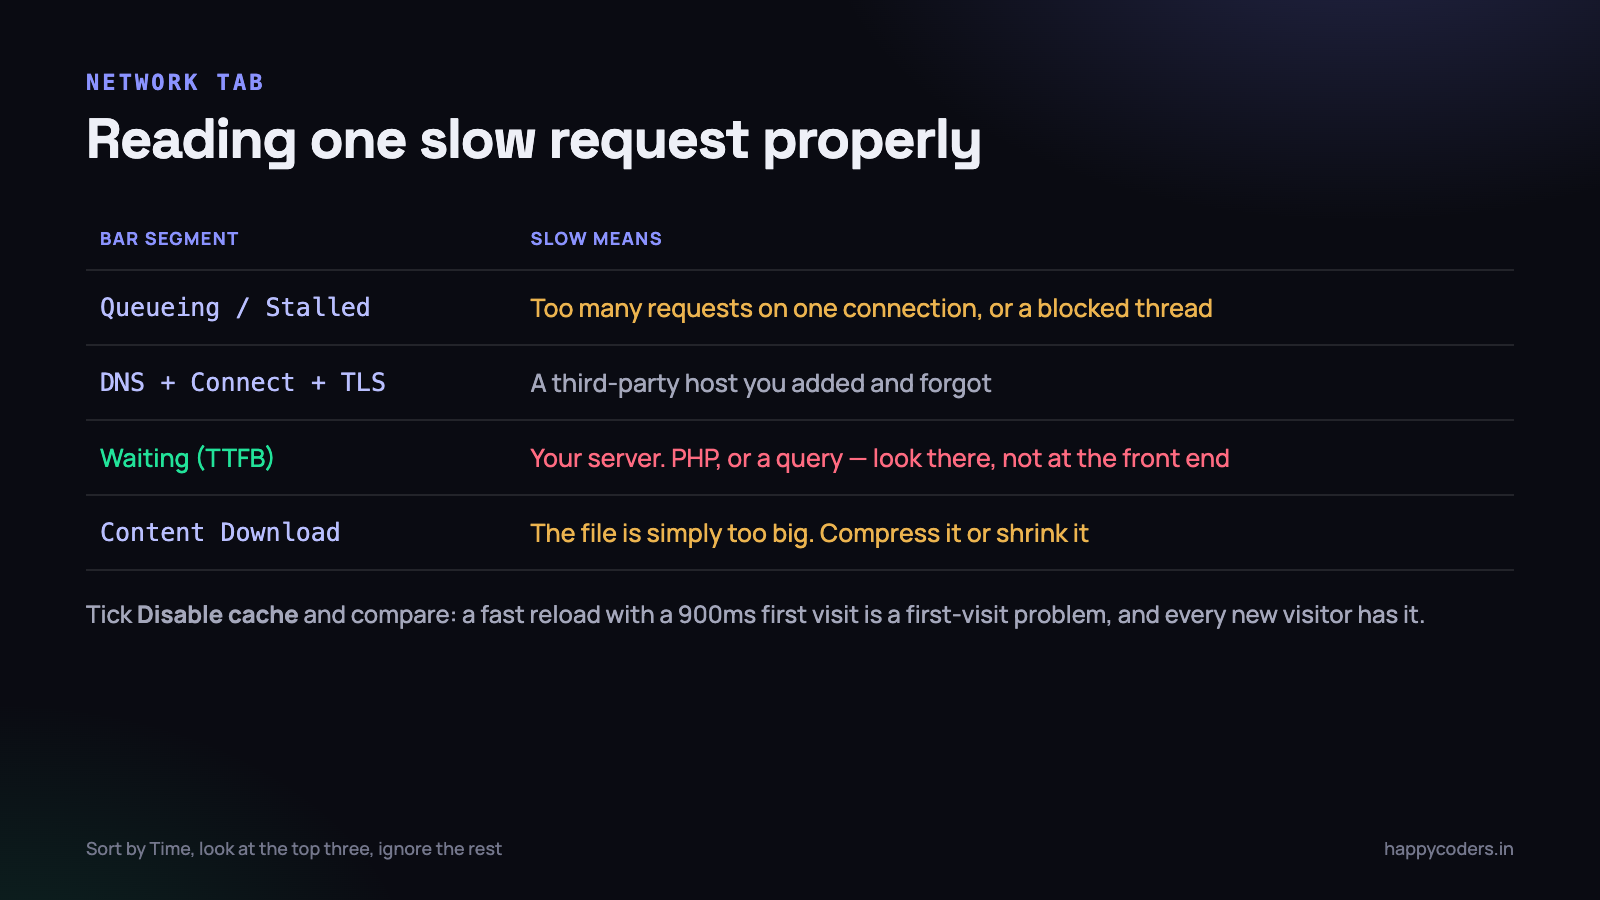
- Queueing or Stalled. The request has not started. Usually too many parallel requests, a render-blocking script ahead of it, or the browser waiting on a connection.
- DNS, Initial connection, SSL. Time spent reaching a host. If this is large it is nearly always a third-party domain — a font service, a chat widget, an analytics script — that somebody added and nobody removed.
- Waiting (TTFB). The request has been sent and the server has not answered yet. This is your backend. No amount of image optimisation or JavaScript bundling changes it.
- Content Download. The server is answering and the bytes are still arriving. The file is too big, or it is not compressed.
That third one is where most misdirected effort goes. If the document request shows 1.4 seconds of Waiting and 40ms of Download, the page is slow because PHP took 1.4 seconds, and the fix is in a query or a loop — look at optimising the PHP side, or instrument it with Telescope or Ray. Minifying CSS will do nothing.
Cached versus not, which are two different sites
Your site is fast for you because you have visited it forty times today. Every visitor from a Google search has an empty cache, and they are having a different experience entirely.
Load it both ways and compare. With Disable cache ticked, you see the first visit. Untick it and reload, and the Size column shows (disk cache) or (memory cache) for everything that was reused. If a font or a hero image is being re-downloaded every time, check the Cache-Control header on it — that is usually a one-line server config fix worth several hundred milliseconds to every returning visitor.
Right-click any request and choose Copy as cURL. You get the complete command — headers, cookies, body — which you can paste into a terminal to reproduce the exact request outside the browser, or hand to a backend developer so they can reproduce it too. It is the fastest way to end an argument about what the front end actually sent.
Throttling to something that resembles reality
The throttling dropdown is the most under-used control in DevTools. Your office fibre connection is not what your customer has, and a page that feels instant on 100 Mbps can take eleven seconds on a congested mobile network in a smaller town.
The presets are a reasonable start, but create a custom profile and keep it. For a decent Indian 4G connection, roughly 3 Mbps down, 1 Mbps up and 150ms of latency is honest. For a busy cell at 7pm, or a train, try 700 kbps down, 300 kbps up and 400ms. Add CPU throttling at 4x or 6x from the Performance panel while you are there, because the phone your customer is holding is not as fast as your laptop, and a lot of “network” slowness is really JavaScript execution.
Latency matters more than bandwidth for most sites. Forty separate small requests at 400ms of round-trip each is a problem that more bandwidth does not solve. That is what makes the request count on the Network panel worth looking at, not just the total size.
The Console, past console.log
Logging is fine. It is also the slowest possible way to inspect a program, because every question requires an edit, a save and a reload. A few Console features remove most of that loop.
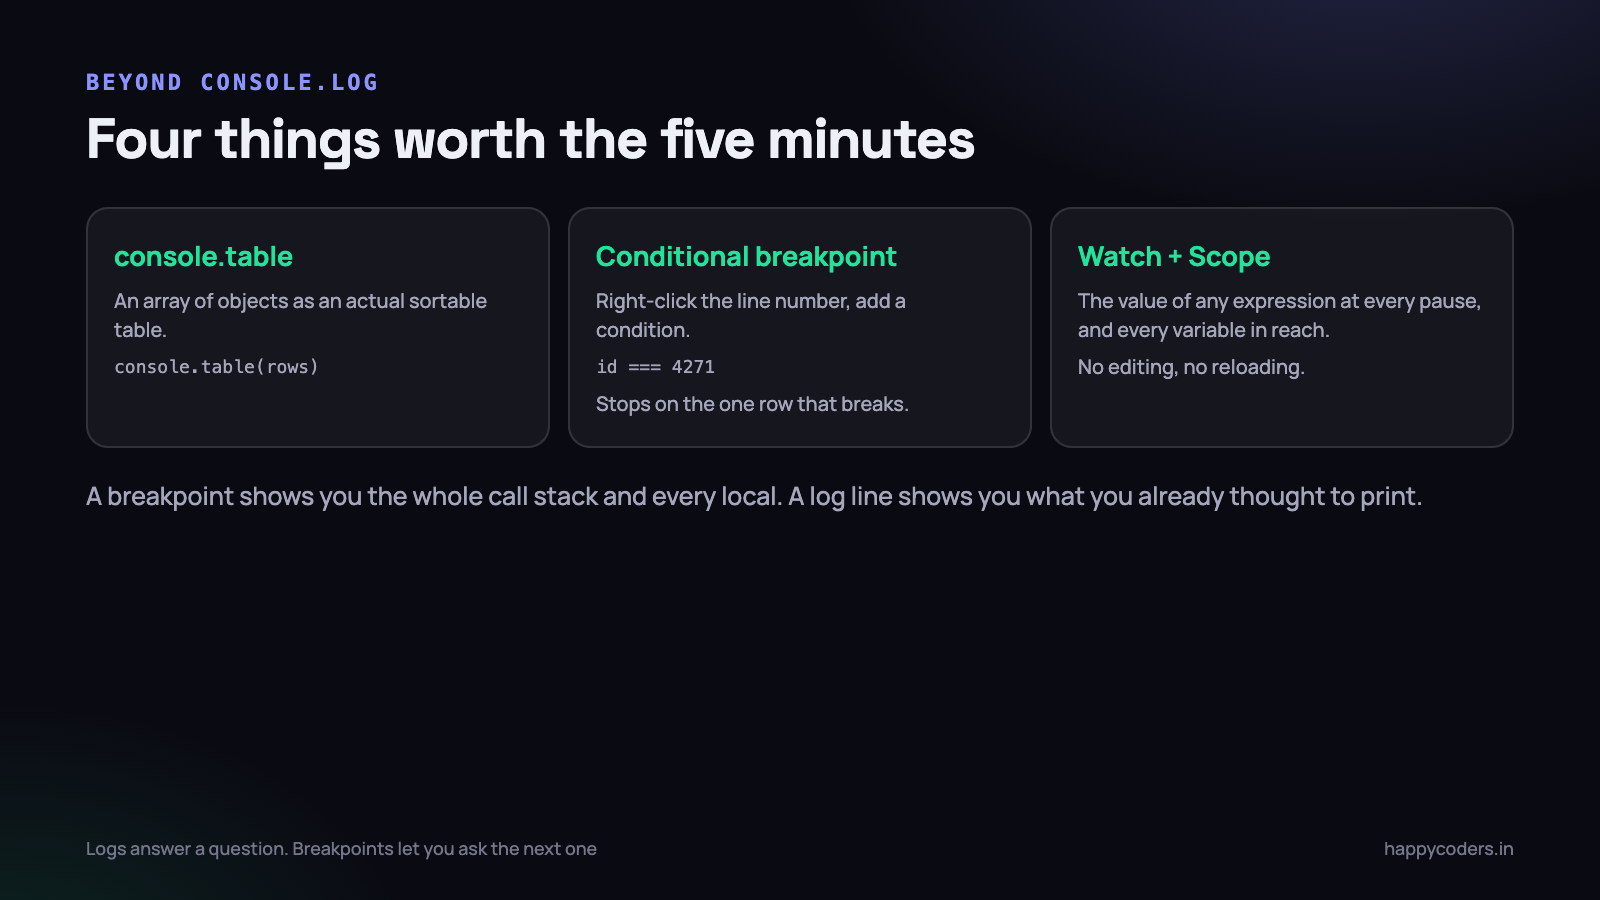
console.table and friends
// an array of objects, as an actual sortable table
console.table(invoices);

// only the columns you care about
console.table(invoices, ['id', 'client', 'total', 'status']);

// group related output so the console stays readable
console.group('Invoice 4271');
console.log('line items', items.length);
console.warn('tax rate missing');
console.groupEnd();

// how long did that actually take?
console.time('render');
renderTable(rows);
console.timeEnd('render');          // render: 412.9ms

// assert instead of an if-wrapped log
console.assert(total > 0, 'total went negative', { id, items });
Also worth knowing: $0 in the Console refers to the element currently selected in the Elements panel, $_ is the result of the last expression, and $$(’selector’) is shorthand for querySelectorAll that returns a real array you can map over. These three save an enormous amount of typing when poking at a live page.
Breakpoints, which are strictly better than logs
A breakpoint pauses execution and hands you everything: every local variable, the whole call stack, and the ability to evaluate arbitrary expressions in that exact scope. A log line gives you the one thing you thought to print before you knew what was wrong.
Open Sources, find the file, click the line number. Reload, and the page stops there.
Conditional breakpoints, which are the reason to bother
This is the feature that changes how debugging feels. A loop runs four thousand times and fails on one row. You do not want to press Resume four thousand times.
Right-click the line number instead of left-clicking, choose Add conditional breakpoint, and type an expression. Execution pauses only when it is true.
// pause on the one row that misbehaves
invoice.id === 4271

// pause only when the value is wrong
total < 0 || Number.isNaN(total)

// pause only for a particular user, on a particular page
user.role === 'admin' && location.pathname.includes('/reports')
The same right-click menu offers a logpoint, which prints an expression and carries on without pausing. It is a console.log that you did not have to add to the source, that works in minified production code, and that vanishes when you remove it — no risk of leaving debugging output in a release.
Watch expressions and the call stack
While paused, the Watch pane on the right evaluates any expression you add, refreshed at every pause. Put items.length, state.filters, or document.activeElement in there and step through — you see exactly when the value changes, without printing anything.
The Call Stack pane next to it answers the question people usually reach for logs to answer: how did we get here? Click any frame to jump to that function with its own variables intact. For a function called from three different places, this is the whole answer in one click.
Breakpoints you did not have to place
- Pause on exceptions. The pause-shaped button in Sources, with “caught exceptions” ticked, stops at the moment a throw happens, with the state still alive. Far better than reading a stack trace after everything has unwound.
- DOM breakpoints. Right-click an element in Elements, Break on, subtree modifications. Use it when something removes or rewrites an element and you have no idea which script is responsible.
- Event listener breakpoints. In Sources, pause on any click, submit or keydown anywhere on the page. This is how you find the handler in a codebase you have never seen.
- XHR breakpoints. Pause whenever a request URL contains a string. Useful when you want the stack that produced a mysterious API call.
Elements, and CSS that refuses to apply
“My CSS is not working” is nearly always one of five things, and the Styles panel tells you which one within seconds if you know what to look at.
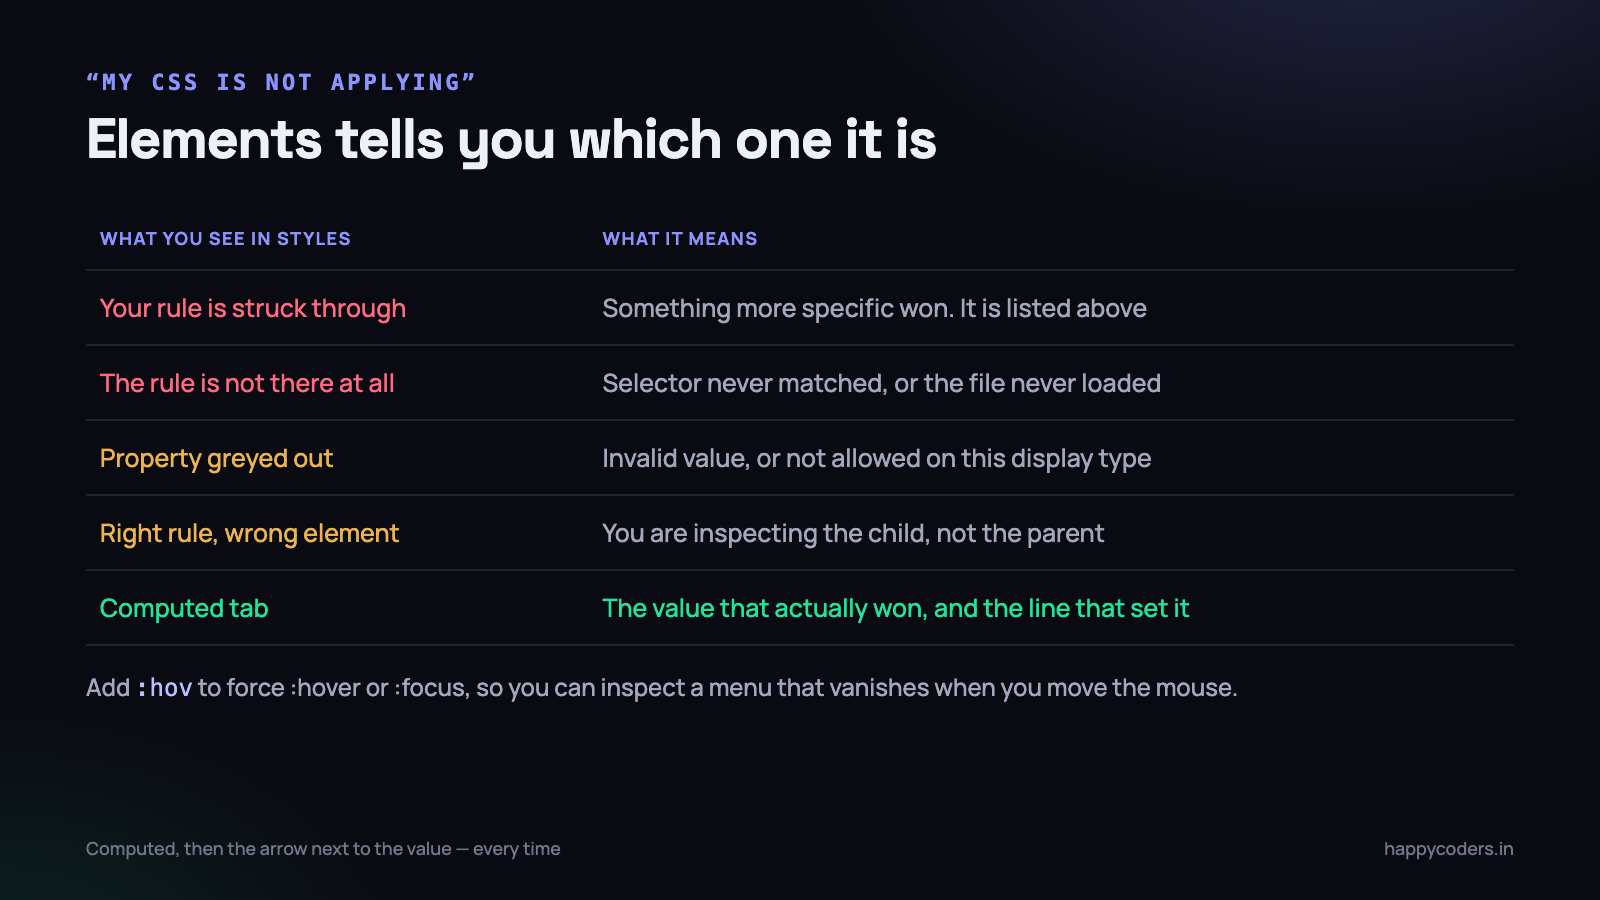
- Your rule is there but struck through. Something more specific overrode it, and the winner is listed above it in the same panel. Fix the specificity rather than adding another
!important. - Your rule is not listed at all. The selector never matched this element, or the stylesheet did not load. Check the Network panel for the CSS file before you touch the rule.
- The property is greyed out. The value is invalid, or the property does not apply to this element — setting a width on an inline element, for instance, or a gap on a non-flex container.
- The rule applies, to a different element. You are inspecting the wrapper and styling the child, or the other way round. The breadcrumb trail along the bottom of the Elements panel shows where you actually are.
- The value is being set by JavaScript. Inline styles appear at the top of the Styles panel under element.style and beat every stylesheet rule that is not marked important.
When in doubt, use the Computed tab. It shows the single value that won for every property, and expanding a property shows the exact rule and file that set it. That is the answer, not a theory about the answer.
Two Elements features people miss
The :hov toggle at the top of the Styles panel lets you force :hover, :focus, :active and :focus-visible on an element. That is how you inspect a dropdown that closes the instant you move the mouse away, or check the contrast of a focus ring.
And the small badges next to elements — flex, grid, scroll — are toggles. Click the grid badge and DevTools overlays the grid lines with their numbers and names on the page, which turns a guessing game about grid-template-areas into something you can see.
Application, for the state you cannot see
The Application panel is where a whole category of confusing bugs lives, particularly the ones that involve logging in.
Under Storage you get Cookies, Local Storage, Session Storage and IndexedDB. For cookies, the columns are the bug report: Domain, Path, Expires, Secure, HttpOnly and SameSite. The classic “I log in and it immediately logs me out” is almost always visible right here — the cookie set on www.example.com while the form posts to example.com, or a Secure cookie on a local HTTP environment, or a SameSite=Strict cookie that is not sent when the payment gateway redirects back.
You can edit and delete cookies directly, which makes testing an expiry or a logout flow a five-second job rather than a wait.
Two other things live here that are worth knowing. Service workers, where the answer to “I deployed twenty minutes ago and still see the old site” usually is — use Update on reload, or Unregister, while debugging. And Clear storage, which wipes cookies, caches, storage and service workers in one click, giving you a genuinely fresh visitor without opening an incognito window.
Performance, read simply
The Performance panel looks intimidating and most developers close it again. You do not need to understand all of it. Record, interact, stop, and look at three things.
- The main thread track. Long solid blocks are long tasks. Anything over about 50ms is a period where the page could not respond to a tap. Click one and the bottom pane names the function and the file.
- The colours. Yellow is scripting, purple is layout and style recalculation, green is painting. A wall of yellow means JavaScript. A lot of purple usually means layout thrashing — code that reads a dimension and then writes a style, over and over, in a loop.
- The screenshots strip. Tick Screenshots before recording and you get frame-by-frame images along the top. Drag across them to see precisely what the user was looking at during that four-second gap, which is often more informative than the flame chart below it.
For most business sites, the answer is one of three things: a third-party script blocking the main thread, an image that is far larger than its display size, or a font loading strategy that leaves the text invisible. All three show up clearly in a thirty-second recording, and none of them require you to read a flame chart properly.
Changing a live site without deploying
Two features turn DevTools from a viewer into a workbench, and both are worth setting up once.
Local Overrides, in the Sources panel, lets you nominate a folder on your machine and then edit any file the site serves — CSS, JavaScript, even a JSON response — with your version persisting across reloads. That means you can reproduce a fix on a client’s production site, confirm it works, and only then write the real change. It is also the sane way to test a copy change or a layout tweak against real production data, without a deployment and without asking anybody for access.
Request blocking, from the Network panel’s right-click menu, blocks a URL or a pattern and reloads. Block the chat widget, block the analytics script, block the ad tag, and see how fast the page is without them. That is how you turn “the marketing tags are probably slowing us down” into a number somebody can act on, and it usually settles the discussion in one reload.
Mobile emulation, and where it stops being true
The device toolbar — the little phone icon, or Ctrl+Shift+M — is genuinely useful and routinely over-trusted. It is worth being precise about what it does and does not simulate.
What it gives you honestly: viewport size, device pixel ratio, a touch-style pointer, the correct user agent string, and media query evaluation. For catching a layout that breaks at 360px wide, it is perfect and it is much faster than picking up a phone.
What it does not give you:
- The real CPU. An entry-level Android phone is several times slower than your laptop. Emulation runs at desktop speed unless you also apply CPU throttling, and even then it is an approximation.
- The real browser. You are still running Chrome’s engine. Safari on iOS is a different engine with different bugs, and it is the one that will surprise you.
- Real touch behaviour. Scroll momentum, the on-screen keyboard pushing your layout up, tap targets under an actual thumb, and the delay after a tap are all things emulation only approximates.
- The real network. Related but separate from throttling — signal that drops mid-request, and a connection that is fast in one street and useless in the next.
So use emulation for layout, and test the last mile on a real device. If you support Apple customers, that means a real iPhone, because Safari is where the genuinely surprising bugs are. On Android you can connect the phone by USB and inspect it at chrome://inspect, giving you the full DevTools against the real browser on the real hardware — which is the best of both and takes two minutes to set up once.
On Monday morning
Three small habits, each of which takes less time than the thing it replaces.
First, the next time you would add a console.log, right-click the line number instead and add a logpoint. If it is inside a loop, make it a conditional breakpoint. You will stop editing and reloading to answer questions, and you will find that most bugs are two questions deep rather than one.
Second, open your slowest page with Network recording and Disable cache ticked, and write down the TTFB of the document request. That one number decides whether the problem is yours to fix in PHP or in the front end, and most teams spend a week on the wrong side of it.
Third, make a custom throttling profile at roughly 3 Mbps and 150ms, name it something like “4G, real”, and leave it selected for a full day of development. You will notice things about your own site that no report would have told you, and they will be the same things your customers have been quietly putting up with.