Six months of tracked time is enough data to answer questions you have been guessing at since you started. Almost nobody opens it, because the reports page looks like a reporting tool and reporting tools feel like admin.
It is one hour, once. Four numbers.
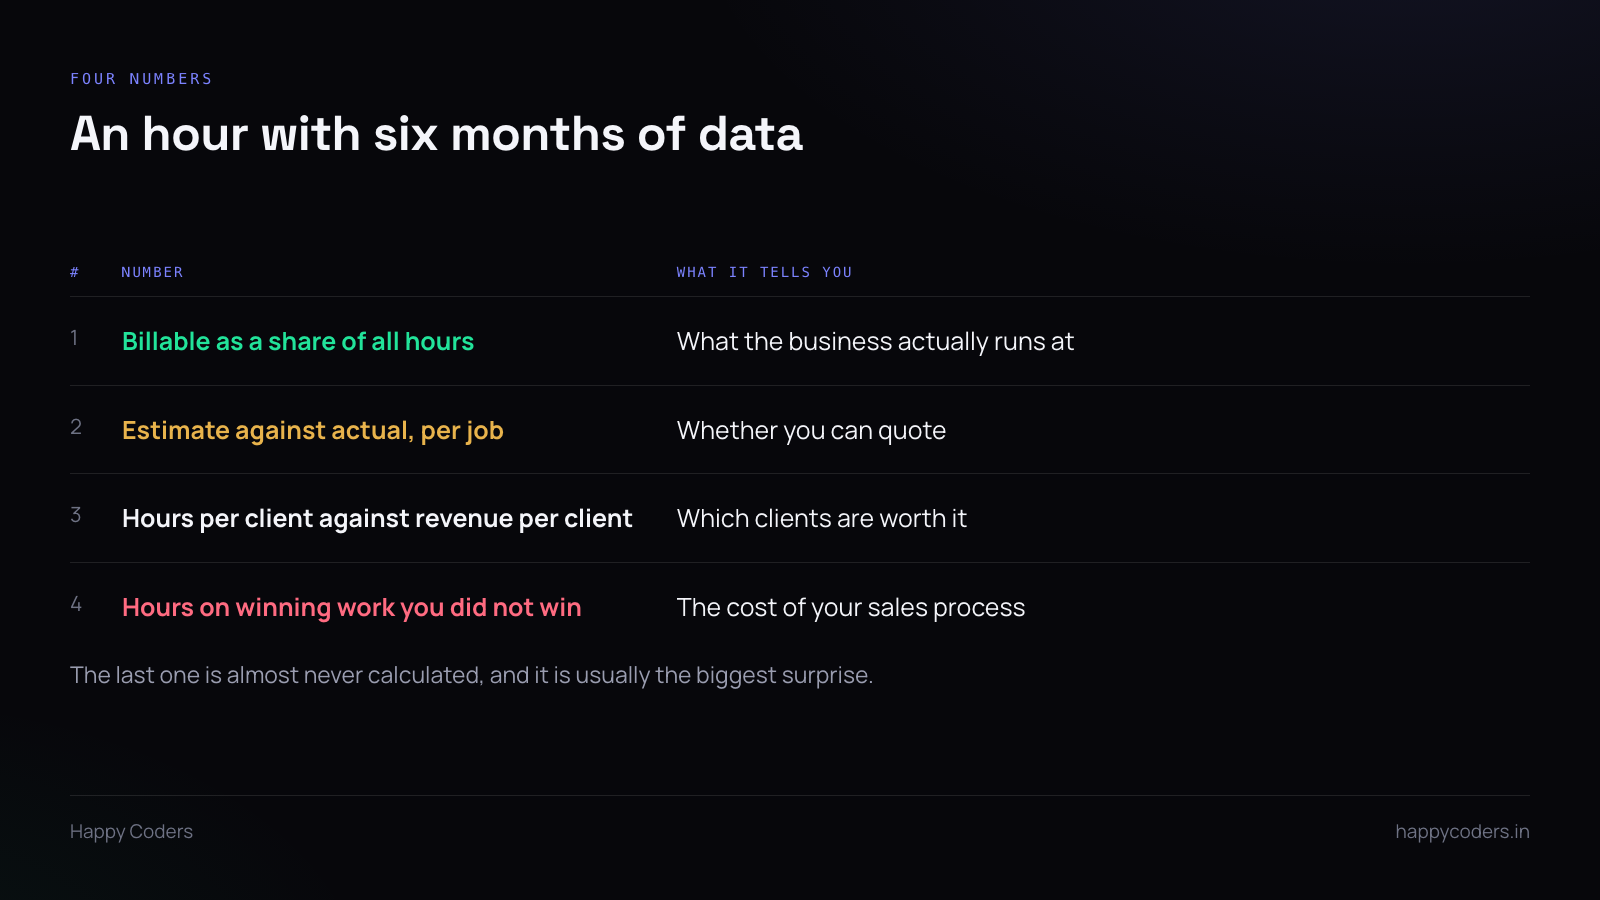
One: what share of hours is billable
Take all hours worked in six months. Take the hours that ended up on an invoice. Divide.
Most people running a service business have a number in their head for this, and the number is usually too high. The real figure includes the proposal that went nowhere, the internal meetings, the recruitment, the day the server fell over, and the client call that was goodwill.
Whatever it comes out at is the rate your business actually runs at, and every quote you have ever written assumed something else. If you price as though eighty per cent of time is billable and it is fifty-five, you have been underpricing for six months without knowing the mechanism.
Two: estimate against actual, per job
For every fixed-price job that finished, you have an estimate and an actual. That pair is the most valuable output of time tracking and the least used.
Do not average them — the average hides the pattern. Look at them individually and ask where the overruns are concentrated.
In most agencies it is not the building. It is review cycles, client delays and the last ten per cent of a project. The build is estimated reasonably; the four rounds of feedback are not estimated at all.
That is actionable in a way “we underestimate” is not. If review is where it goes, quote review as a line with hours on it.
Three: hours per client against revenue per client
Rank clients by revenue. Then rank them by hours. Compare the two lists.
The client who is third by revenue and first by hours is the one worth talking about. They are not necessarily a bad client — sometimes the work is genuinely harder — but you should know, and currently you probably do not.
A caution: this number is only honest if non-billable time is attributed to the client it belongs to. Three hours a week of unbilled calls with one client is the thing that makes them expensive, and if those hours sit in a general bucket the comparison says nothing.
Four: the hours you spent winning work you did not win
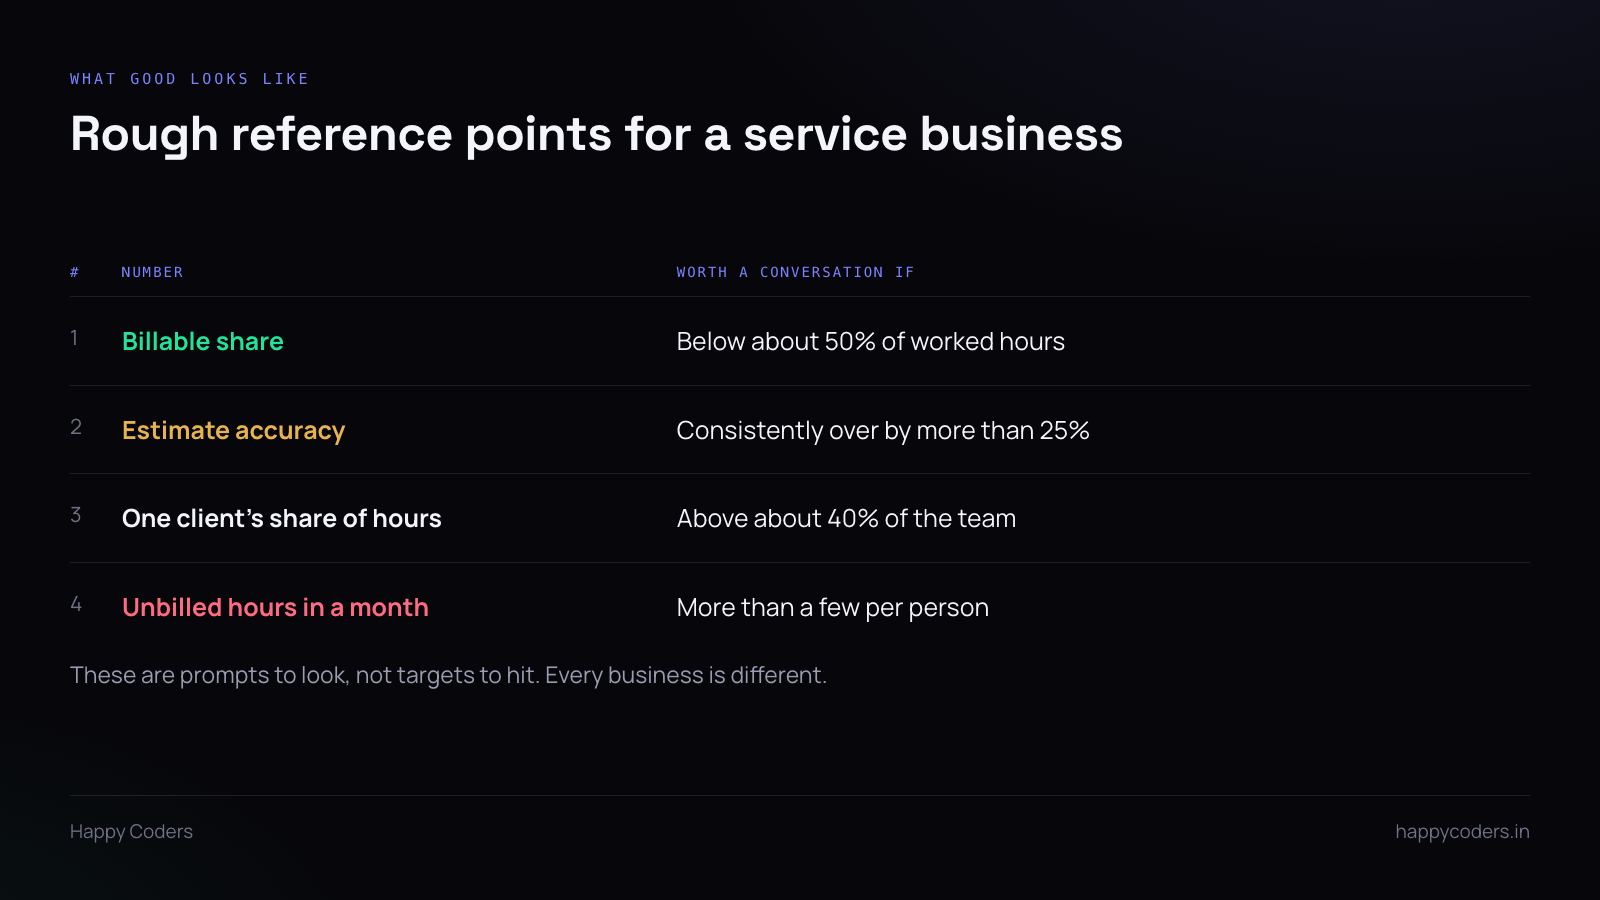
This is the one almost nobody has.
Add up the time on proposals, pitches, scoping calls and estimates for work that did not become a project. Six months of it.
Most small agencies are shocked, because it is senior time — the people writing proposals are the expensive ones — and because it is completely invisible in every other report. It never appears on an invoice, so it never appears anywhere.
Knowing it changes how you qualify. Not into refusing to pitch, but into noticing that a particular kind of enquiry has cost you forty hours this year and produced nothing.
This only works if proposals had their own project from the start. If they were logged to the client who never became a client, or to Internal, the number cannot be recovered now — but it can be set up for the next six months.
What not to do with it
Do not rank people. Six months of time data will let you produce a league table of billable hours per person, and it will be wrong in an interesting way: the person who is lowest is often the one unblocking everyone else. Build it and you will optimise for the wrong behaviour within a month.
Do not set a billable target without changing anything else. A target with no corresponding change in how work arrives just teaches people to classify more of their day as billable.
Write down what you find
Four numbers and a sentence each. Put them somewhere you will see them in six months.
The value is in the comparison. A billable share of fifty-five per cent means very little on its own, and means a great deal next to the fifty-one per cent from six months ago. That is the only way to tell whether anything you did worked.